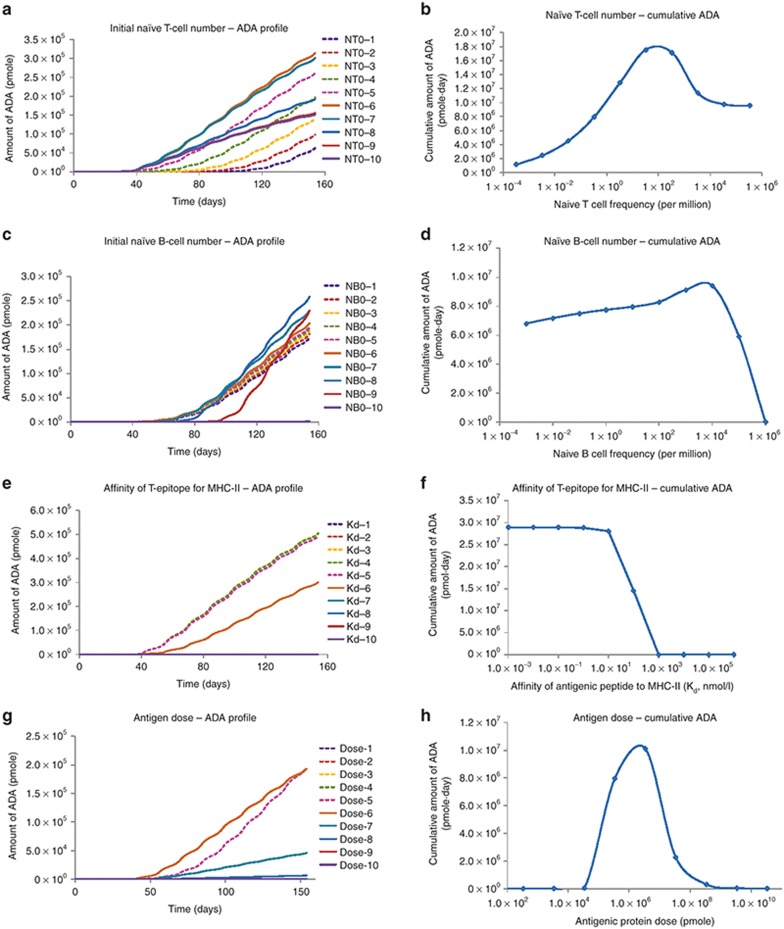
Figure 5.
Model simulated ADA responses under physiologically plausible range of parameter values. (a,c,e,g) Model simulated kinetic profiles for ADA.(b,d,f,h) Cumulative amount of ADA during the simulation time against parameters of interest. The parameters of interest are: panels a and b, initial naïve T-cell number; panels c and d, initial naïve B-cell number; panels e and f, affinity of T-epitope for MHC-II; panels g and h, antigen dose. The numbers 1 to 10 on the left panels stand for 10 different parameter conditions, from low to high amounts. More details can be found in the Methods section. ADA, antidrug antibody.

