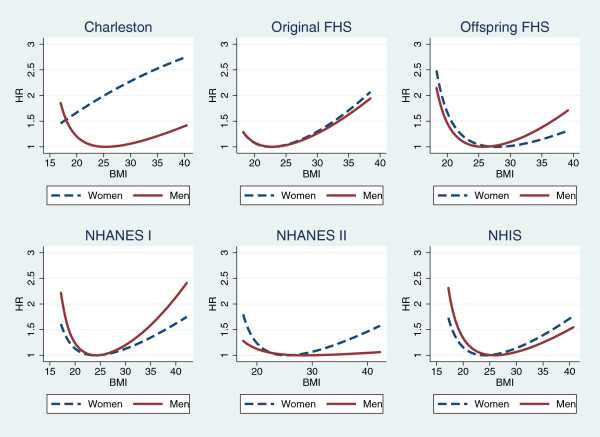
Figure 1.
Hazard ratios of BMI based on Cox models for individual cohorts. For each curve, the hazard ratio at the vertex is 1 (control point). The vertex for Charleston Women is outside of the data range so that the curve looks monotonic. Each line is plotted within the range of 1st - 99th percentiles of BMI at baseline.

