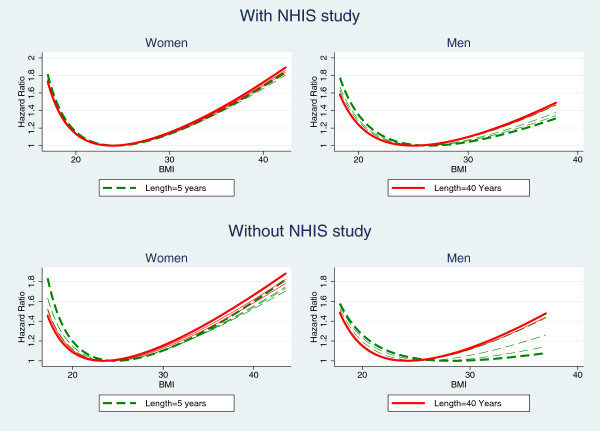
Figure 3.
Hazard ratios of BMI of Cox models based on pooled data with survival times censored at 5, 10, 15, …,40 years. The hazard ratio at the vertex of each U- or J-shaped curve is 1 (control point). Each line is plotted within the range of 1st - 99th percentiles of baseline BMI of all individuals. The curves for censoring at 5 years (dashed) and 40 years (solid) are in thick lines and those of other lengths are in thin lines. Top two plots are based on data with NHIS cohort and the lower two plots are based on data excluding NHIS that has the largest sample size and the shortest length of follow-up.

