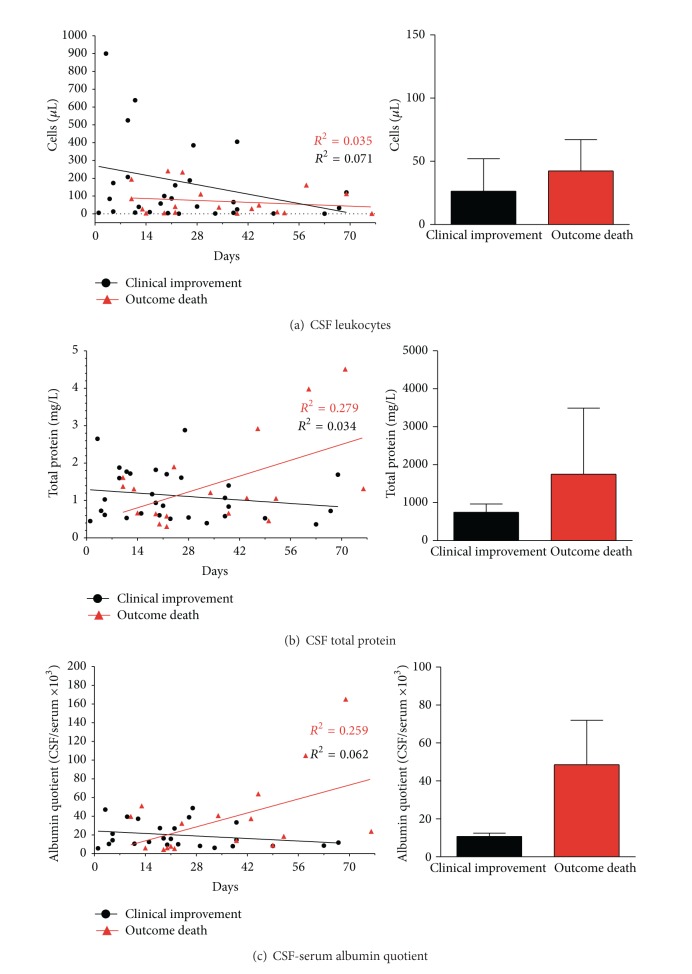
Figure 2.
Illustration of CSF parameters in cryptococcal meningoencephalitis. In (a) values present CSF cell counts while (b)-(c) show values of total CSF protein and CSF-serum albumin quotient (QAlb) after onset of symptoms and during disease course and antifungal therapy. Initial CSF analysis was performed in all patients, while during follow-up CSF was analysed in thirteen patients (eight patients with good outcome and five patients with fatal outcome). Black points mark values of patients with clinical improvement, while red triangles indicate values of patients with the outcome death. On the right side additional graphs present mean values and standard deviation of both groups in the course of antifungal therapy.

