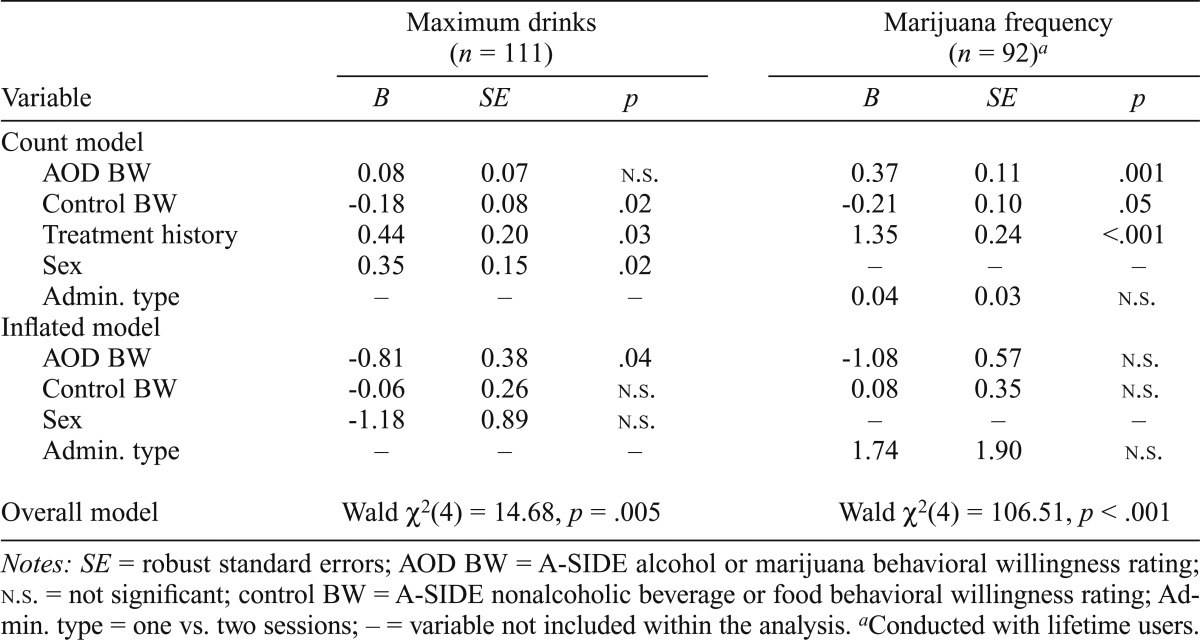
Table 1.
Prediction of 30-day drinking patterns (past 3 months)

| Maximum drinks (n = 111) |
Marijuana frequency (n = 92)a |
|||||
| Variable | B | SE | p | B | SE | p |
| Count model | ||||||
| AOD BW | 0.08 | 0.07 | n.s. | 0.37 | 0.11 | .001 |
| Control BW | -0.18 | 0.08 | .02 | -0.21 | 0.10 | .05 |
| Treatment history | 0.44 | 0.20 | .03 | 1.35 | 0.24 | <.001 |
| Sex | 0.35 | 0.15 | .02 | – | – | – |
| Admin. type | – | – | – | 0.04 | 0.03 | n.s. |
| Inflated model | ||||||
| AOD BW | -0.81 | 0.38 | .04 | -1.08 | 0.57 | n.s. |
| Control BW | -0.06 | 0.26 | n.s. | 0.08 | 0.35 | n.s. |
| Sex | -1.18 | 0.89 | n.s. | – | – | – |
| Admin. type | – | – | – | 1.74 | 1.90 | n.s. |
| Overall model | Wald χ2(4) = 14.68, p = .005 | Wald χ2(4) = 106.51, p < .001 | ||||
Notes: SE = robust standard errors; AOD BW = A-SIDE alcohol or marijuana behavioral willingness rating; n.s. = not significant; control BW = A-SIDE nonalcoholic beverage or food behavioral willingness rating; Admin, type = one vs. two sessions; – = variable not included within the analysis.
Conducted with lifetime users.
