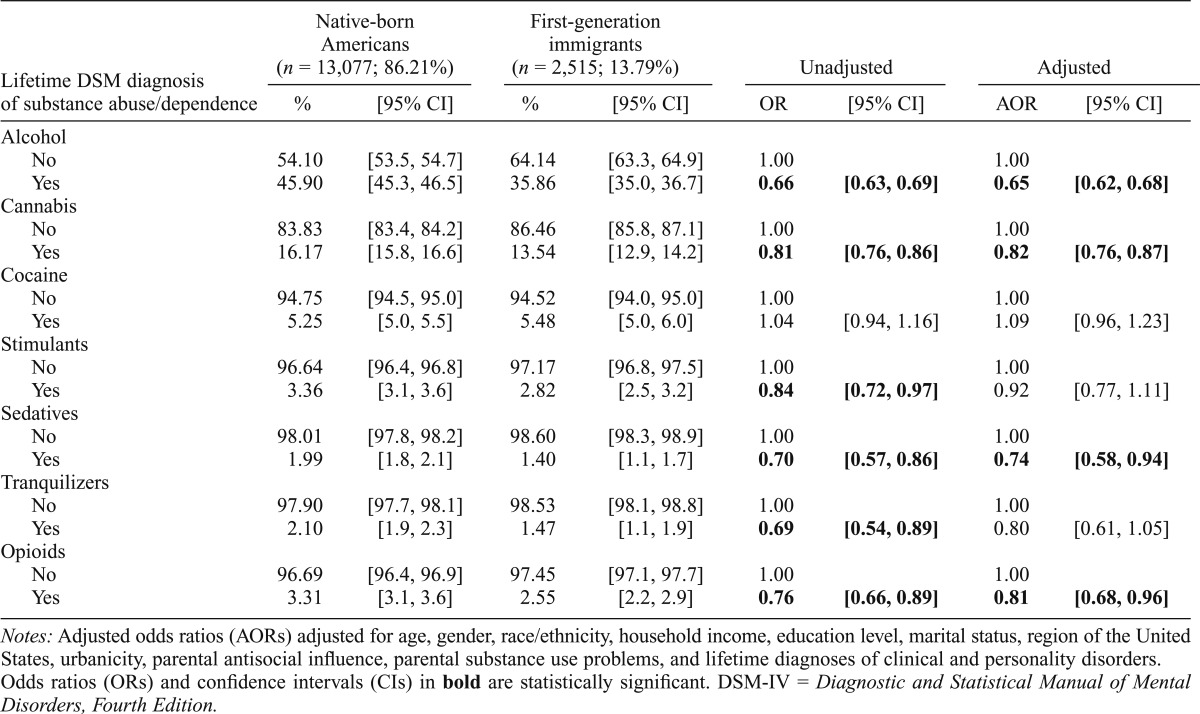
Table 3.
Lifetime substance use disorders among native-born Americans and second-generation immigrants to the United States

| Lifetime DSM diagnosis of substance abuse/dependence | Native-born Americans (n = 13,077; 86.21%) |
First-generation immigrants (n = 2,515; 13.79%) |
Unadjusted |
Adjusted |
||||
| % | [95% CI] | % | [95% CI] | OR | [95% CI] | AOR | [95% CI] | |
| Alcohol | ||||||||
| No | 54.10 | [53.5, 54.7] | 64.14 | [63.3, 64.9] | 1.00 | 1.00 | ||
| Yes | 45.90 | [45.3, 46.5] | 35.86 | [35.0, 36.7] | 0.66 | [0.63, 0.69] | 0.65 | [0.62, 0.68] |
| Cannabis | ||||||||
| No | 83.83 | [83.4, 84.2] | 86.46 | [85.8, 87.1] | 1.00 | 1.00 | ||
| Yes | 16.17 | [15.8, 16.6] | 13.54 | [12.9, 14.2] | 0.81 | [0.76, 0.86] | 0.82 | [0.76, 0.87] |
| Cocaine | ||||||||
| No | 94.75 | [94.5, 95.0] | 94.52 | [94.0, 95.0] | 1.00 | 1.00 | ||
| Yes | 5.25 | [5.0, 5.5] | 5.48 | [5.0, 6.0] | 1.04 | [0.94, 1.16] | 1.09 | [0.96, 1.23] |
| Stimulants | ||||||||
| No | 96.64 | [96.4, 96.8] | 97.17 | [96.8, 97.5] | 1.00 | 1.00 | ||
| Yes | 3.36 | [3.1, 3.6] | 2.82 | [2.5, 3.2] | 0.84 | [0.72, 0.97] | 0.92 | [0.77, 1.11] |
| Sedatives | ||||||||
| No | 98.01 | [97.8, 98.2] | 98.60 | [98.3, 98.9] | 1.00 | 1.00 | ||
| Yes | 1.99 | [1.8, 2.1] | 1.40 | [1.1, 1.7] | 0.70 | [0.57, 0.86] | 0.74 | [0.58, 0.94] |
| Tranquilizers | ||||||||
| No | 97.90 | [97.7, 98.1] | 98.53 | [98.1, 98.8] | 1.00 | 1.00 | ||
| Yes | 2.10 | [1.9, 2.3] | 1.47 | [1.1, 1.9] | 0.69 | [0.54, 0.89] | 0.80 | [0.61, 1.05] |
| Opioids | ||||||||
| No | 96.69 | [96.4, 96.9] | 97.45 | [97.1, 97.7] | 1.00 | 1.00 | ||
| Yes | 3.31 | [3.1, 3.6] | 2.55 | [2.2, 2.9] | 0.76 | [0.66, 0.89] | 0.81 | [0.68, 0.96] |
Notes: Adjusted odds ratios (AORs) adjusted for age, gender, race/ethnicity, household income, education level, marital status, region of the United States, urbanicity, parental antisocial influence, parental substance use problems, and lifetime diagnoses of clinical and personality disorders. Odds ratios (ORs) and confidence intervals (CIs) in bold are statistically significant. DSM-IV = Diagnostic and Statistical Manual of Mental Disorders, Fourth Edition.
