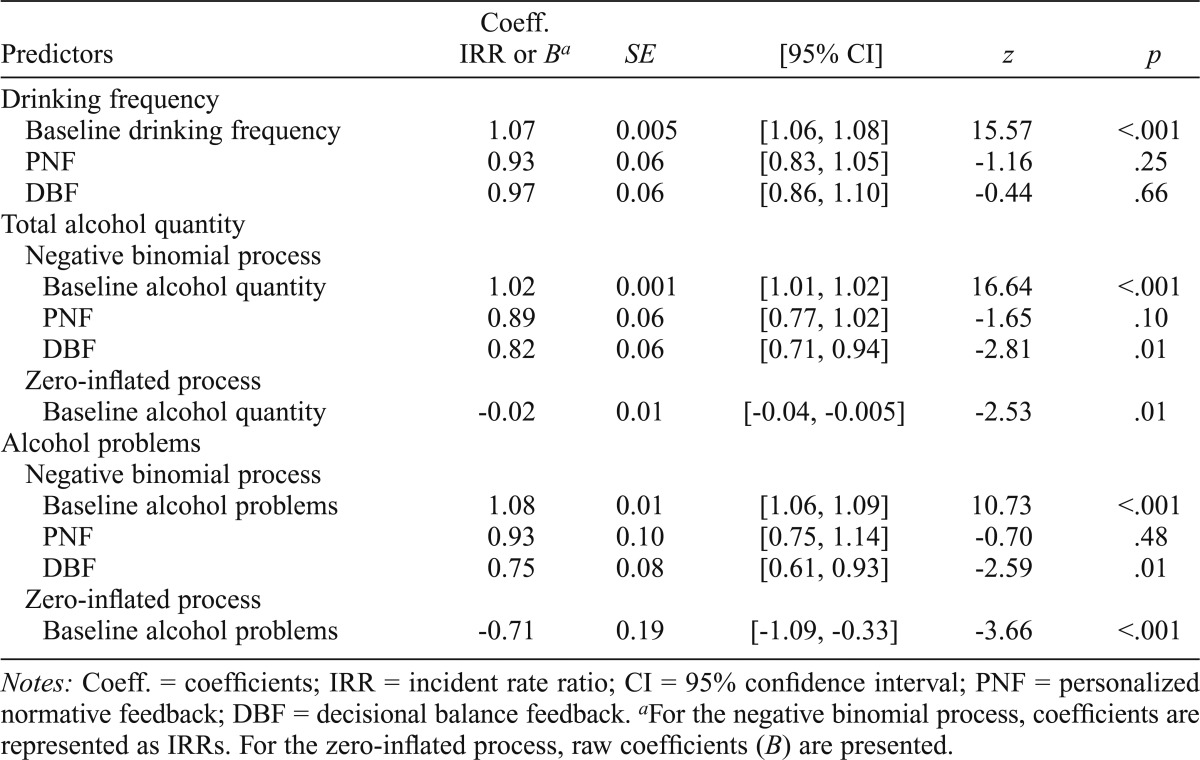
Table 4.
Model parameters for mid-term drinking outcomes (6-month follow-up)

| Predictors | Coeff. IRR or Ba | SE | [95% CI] | z | p |
| Drinking frequency | |||||
| Baseline drinking frequency | 1.07 | 0.005 | [1.06, 1.08] | 15.57 | <.001 |
| PNF | 0.93 | 0.06 | [0.83, 1.05] | -1.16 | .25 |
| DBF | 0.97 | 0.06 | [0.86, 1.10] | -0.44 | .66 |
| Total alcohol quantity | |||||
| Negative binomial process | |||||
| Baseline alcohol quantity | 1.02 | 0.001 | [1.01, 1.02] | 16.64 | <.001 |
| PNF | 0.89 | 0.06 | [0.77, 1.02] | -1.65 | .10 |
| DBF | 0.82 | 0.06 | [0.71, 0.94] | -2.81 | .01 |
| Zero-inflated process | |||||
| Baseline alcohol quantity | -0.02 | 0.01 | [-0.04, -0.005] | -2.53 | .01 |
| Alcohol problems | |||||
| Negative binomial process | |||||
| Baseline alcohol problems | 1.08 | 0.01 | [1.06, 1.09] | 10.73 | <.001 |
| PNF | 0.93 | 0.10 | [0.75, 1.14] | -0.70 | .48 |
| DBF | 0.75 | 0.08 | [0.61, 0.93] | -2.59 | .01 |
| Zero-inflated process | |||||
| Baseline alcohol problems | -0.71 | 0.19 | [-1.09,-0.33] | -3.66 | <.001 |
Notes: Coeff. = coefficients; IRR = incident rate ratio; CI = 95% confidence interval; PNF = personalized normative feedback; DBF = decisional balance feedback.
For the negative binomial process, coefficients are represented as IRRs. For the zero-inflated process, raw coefficients (B) are presented.
