Figure 3.

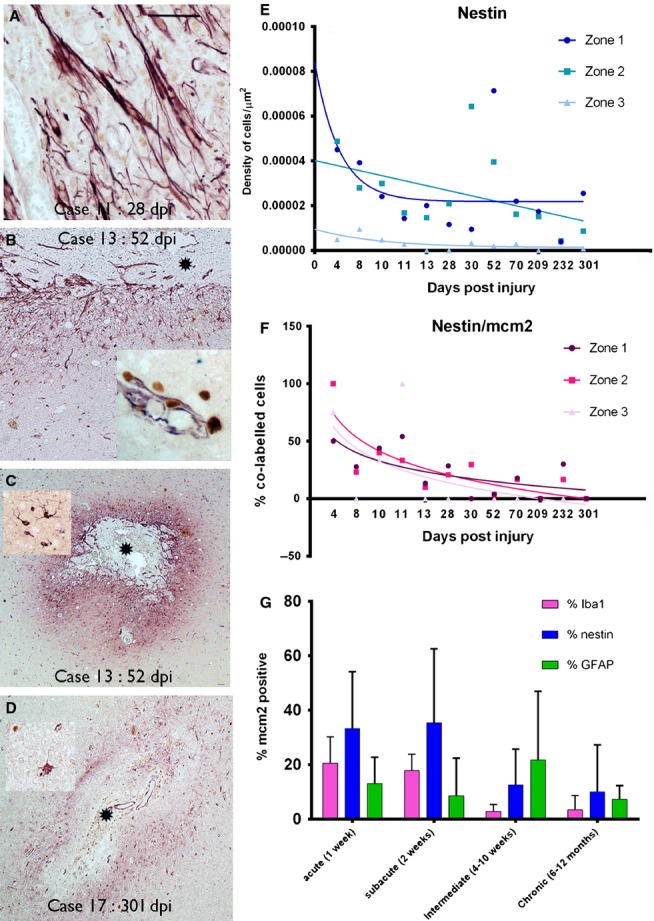
Nestin-expressing cells (nestin cells labelled in red and MCM2 nuclear labelling in brown in A–D). (A) ‘Strap-like’ or bipolar, elongated NECs were a prominent morphological cell type in the early ICE lesions in zone 1 as shown in a 28-day-old injury. (B) The gradient of distribution of nestin in relation to the injury core (*) with elongated cells concentrating in the immediate zone and fewer, scattered multipolar cells away from the lesion (bottom of image); inset: elongated cells extending alongside new vessels into the core of the injury with a ‘double layer’ of nestin-positive NECs surrounding nestin-positive endothelium. (C) Nestin is strikingly concentrated around the immediate injury zone at low magnification; inset: a typical nestin-positive multipolar glial cell. (D) Nestin expression remained localized to the ICE, demarcating the injury site, in the most chronic lesions, as shown at 301 days; in older lesions degenerate-appearing NECs were visible with cytoplasmic vacuolation. (E) Graphical representation of the density of nestin-positive cells in ICE injuries plotted against dpi. The data are shown for the three zones (1–3) of increasing distance away from the ICE injury site (see text for details of zones) with each point representing the mean values from all sections and cases analysed at each dpi time point; best fit non-linear regression analysis lines are shown for each zone. The x-axis displays each time point of analysis and is a non-linear scale. Statistical analysis showed no significant difference in cell densities between zone 1 and 2 but significantly lower cell densities in zone 3 compared with zone 1 (P < 0.0001). There was a significant regression in NEC density with dpi in zone 2 (P < 0.0001, R2 = 0.233). (F) A similar graphical representation for the decline in the percentage of nestin cells colocalized with MCM2 with dpi is shown for all three zones. Statistical non-linear regression analysis of data showed a significant decline in this index for nestin in zones 1 and 2 but not zone 3 (zone 1: P = 0.038, R2 = 0.257; zone 2: P = 0.024, R2 = 0.295; zone 3: P = 0.138, R2 = 0.14). (G) Bar chart of the percentages of glial cell types colocalizing with MCM2 indicating their regenerative index; the data are shown for zone 1 (the region immediately surrounding the ICE injury) and for acute, subacute, intermediate and chronic ICE injuries (see text for definition of intervals). This illustrates the decline in the MCM2 index for IBA1 and nestin populations with chronicity of injury whereas a similar decline is not seen for GFAP-positive glia. NECs in acute and subacute lesions have the highest replicative index. dpi, days post injury or implantation of the depth/grid electrode until resective surgery. Asterisk in each figure indicates the core or centre of the ICE injury. Scale bar is equivalent to approximately 40 μm in A, and 250 μm in B–D.
