Figure 7.

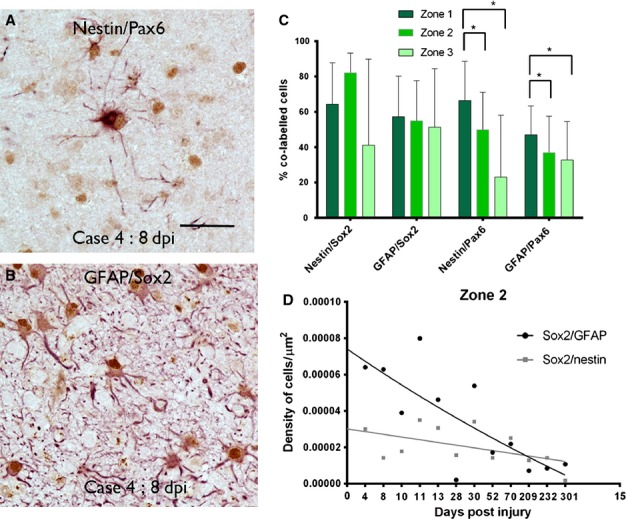
SOX2 and PAX6 expression at injury site. A proportion of multipolar, reactive and hypertrophic glial cells in the margins of the injury showed nuclear labelling (brown) with PAX6 and SOX2 as shown for nestin (in red)/PAX6 (A) and GFAP(red)/SOX2 (B). (C) Bar chart of the percentage of GFAP- or nestin-expressing cells that colocalized with SOX2 or PAX6 in the three zones is shown for all time points (error bars are SD). There was a significantly greater percentage (of both GFAP and nestin) PAX6-positive glial cells in zone 1 (immediately surrounding the injury) than in zone 2 or 3 in all cases (*P < 0.001). (D) Graphical representation of the density of SOX2/GFAP and SOX2/nestin co-labelled cells with dpi shown for zone 2. Each point represents the mean values for all cases at that time point with regression lines drawn in for each zone. The x-axis displays each time point of analysis and is a non-linear scale. Statistical non-linear regression analysis of data confirmed a significant decline in the percentage of SOX2/GFAP expressing cells with dpi (P = 0.053, R2 = 0.028) but not nestin/SOX2 cells (P = 0.053, R2 = 0.22). Scale bar in A is equivalent to approximately 40 μm.
