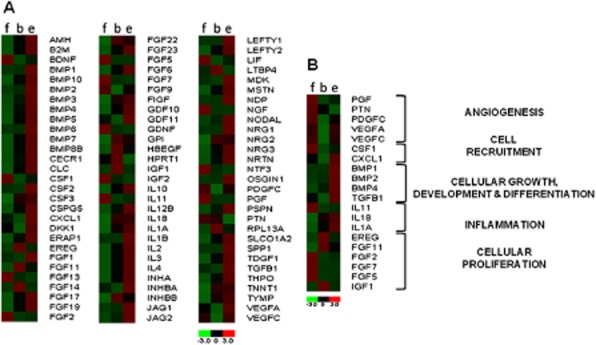
Figure 5.

Gene expression varies between Fibroblast matrix (f), BLCC (b), and Epithelium only (e). The heat map shows relative gene expression of the experimental groups (x-axis) normalized to GAPDH and β-actin housekeeping genes. The full growth factor array is shown in (A), while a subset of wound healing genes is highlighted in (B). BLCC, bilayered living cellular construct.
