Figure 5.
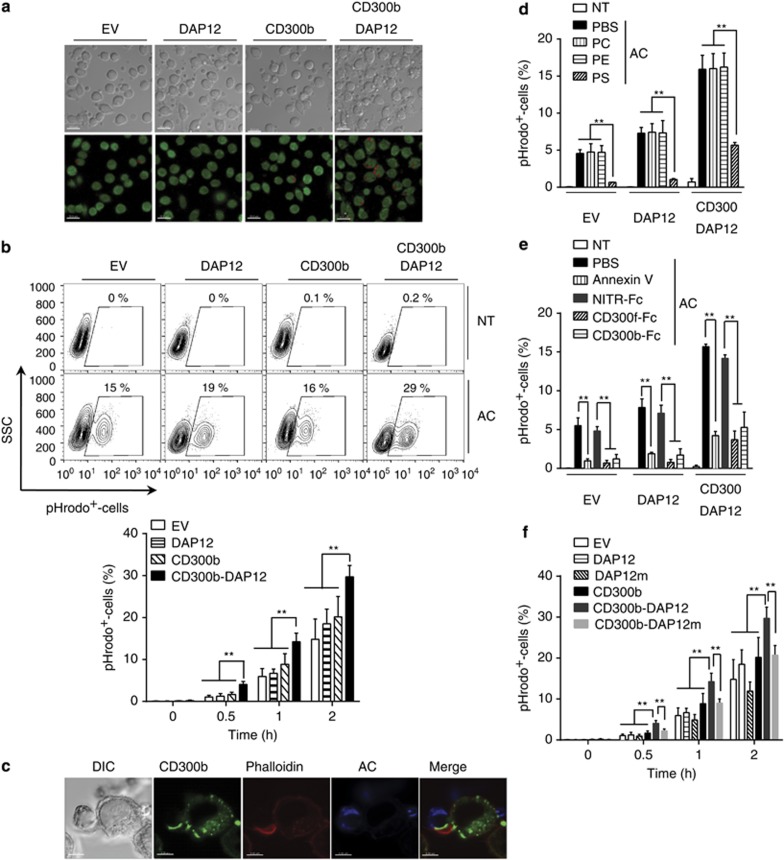
CD300b promotes efferocytosis in a DAP12-dependent manner. (a) EV-, DAP12-, CD300b- and CD300b-DAP12-expressing L929 cells were labeled with CFSE, mixed with pHrodo-labeled apoptotic cells (AC) and the percentage of engulfment of (pHrodo+) cells was analyzed by confocal microscopy (a) and flow cytometry (b). (a) CFSE-labeled L929 cells are shown green, while engulfed pHrodo+-labeled apoptotic cells are displayed in red (lower panel); the DIC images are shown in the upper panel. Scale bars, 20 μm. (b) The contour plots (upper panel) illustrate the gating strategy whereas the quantification of the percentage of pHrodo+ cells is summarized in the bar graph (bottom panel; error bars represent S.E.M.). (c) L929 cells expressing Myc-tagged CD300b were cultured in glass-bottom dishes, and incubated with TFL4-labeled apoptotic cells (AC, blue). The cells were then fixed, washed and stained using anti-cMyc antibody, followed by Alexa647-conjugated secondary antibody (green). F-actin was stained using phalloidin-Alexa568 (red). Scale bars, 5 μm. (d) EV-, DAP12- and CD300b-DAP12-expressing L929 cells were cultured in the presence or absence of PC-, PE- or PS-coated liposomes (10 μM) and then mixed at a 1:4 ratio with pHrodo-labeled apoptotic cells (AC) for 60 min. Percentage of cells containing apoptotic thymocytes (pHrodo+-cells) was analyzed by flow cytometry, as described in b. (e) pHrodo-labeled apoptotic cells (AC) were cultured in the presence or absence of 50 μg/ml Annexin V, CD300f-Fc, CD300b-Fc or NITR-Fc proteins and then incubated with EV-, DAP12- and CD300b-DAP12-expressing L929 cells at a 4:1 ratio for 60 min. Percentage of pHrodo+-cells was analyzed by flow cytometry, as in b. (f) EV-, DAP12-, DAP12m-, CD300b-DAP12-, CD300b-DAP12m-expressing L929 cells were mixed with pHrodo-labeled apoptotic cells (AC) at a 1:4 ratio, and the percentage of pHrodo+-cells was analyzed by flow cytometry, as in b. All data shown are derived from three independent experiments, and the bar graphs shown in b and d–f represent mean+S.E.M.; **P<0.01 (Student's t-test)

