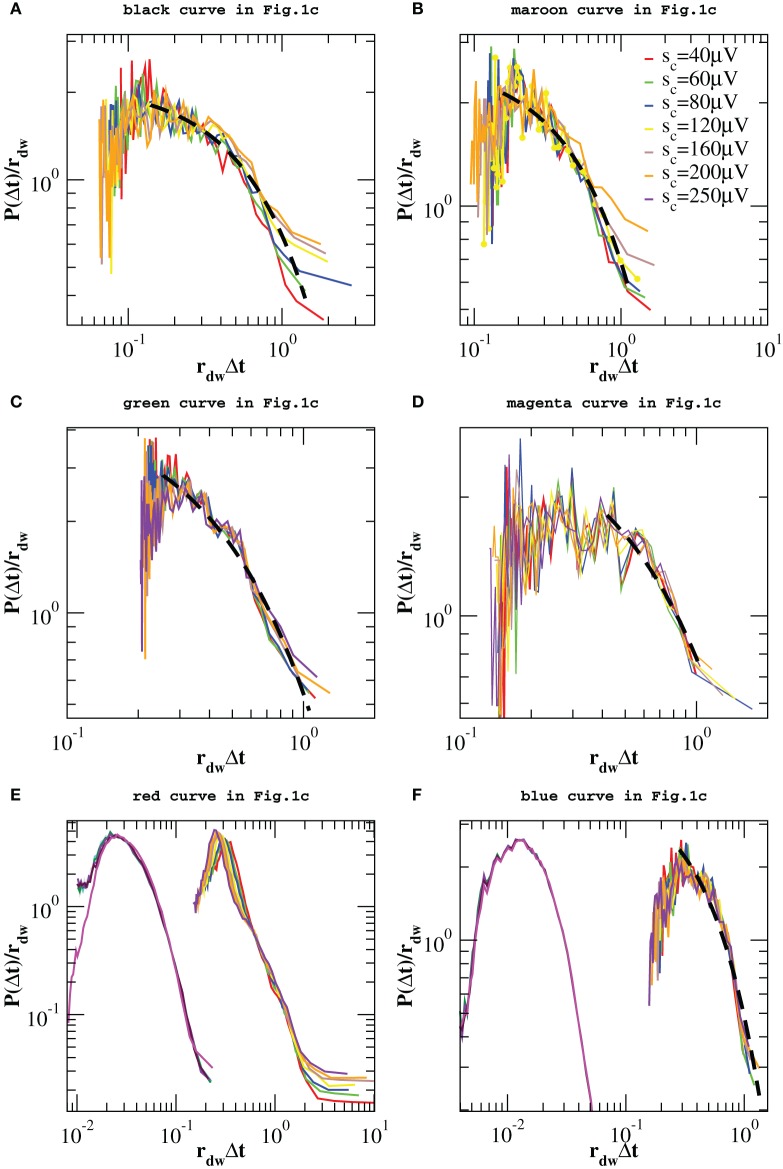
Figure 7.
Distributions of quiet times P(Δt; sc) in the down-state for the experimental data samples of Figure 1C and the numerical samples reproducing blue squares and red diamonds curve of Figure 1C. Distributions are rescaled by the mean rate rdw in the down-state. In five of the analyzed samples the tail of the distribution is well fitted by an exponential (black dashed line in A–D,F). Numerical data are shown in (E,F) together with the corresponding experimental curves of Figure 1C and shifted by 1 order of magnitude to the left, for clarity. Numerical distributions are averaged over 100 configurations of a network of N = 64000 neurons with pin = 0.1.

