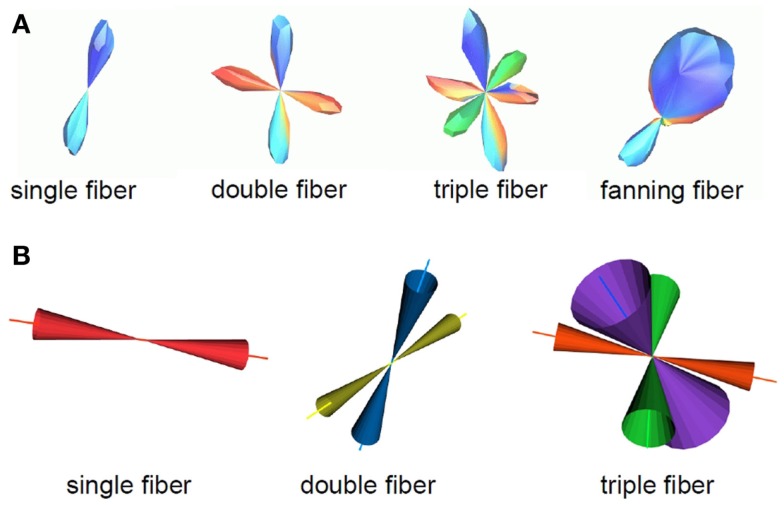
Figure 2.
A summary of the fiber configurations obtained from the probabilistic curve inference labeling is shown. (A) PDFs for the direction of propagation of tractography. The algorithm produces output for four possible configurations, which are, from left to right, a single (potentially curving) fiber bundle, double crossing, triple crossing, and fanning fibers. These distributions come from one b = 3000 s/mm2 dataset on which curve inference was run. (B) Confidence intervals for the mean of these distributions are also obtained. Here, the 95% confidence intervals for the mean fiber ODF maximum are shown for the non-fanning cases, using the b = 1000 s/mm2 dataset.

