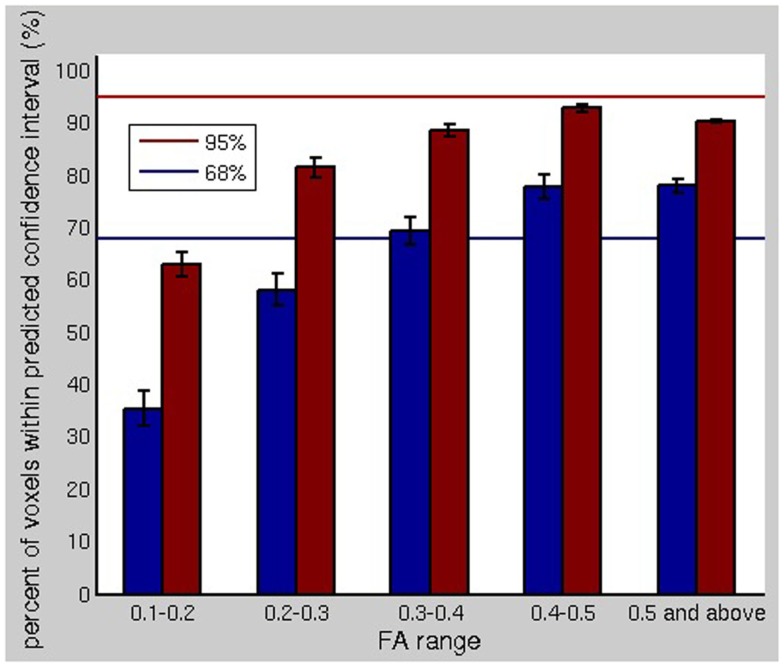
Figure 6.
The comparison of the bootstrap uncertainty profiles for fiber orientations is shown. The blue and red bars show the percent of the voxels in the brain for which the fiber orientations, computed without bootstrapping, lay within the 68 and 95% bootstrap-predicted confidence intervals for the fiber orientation using a separate dataset. For major fiber tracts (i.e., FA >0.3), the correspondence between the observed variability in the fiber ODF maxima and the variability predicted by the bootstrap was very good.

