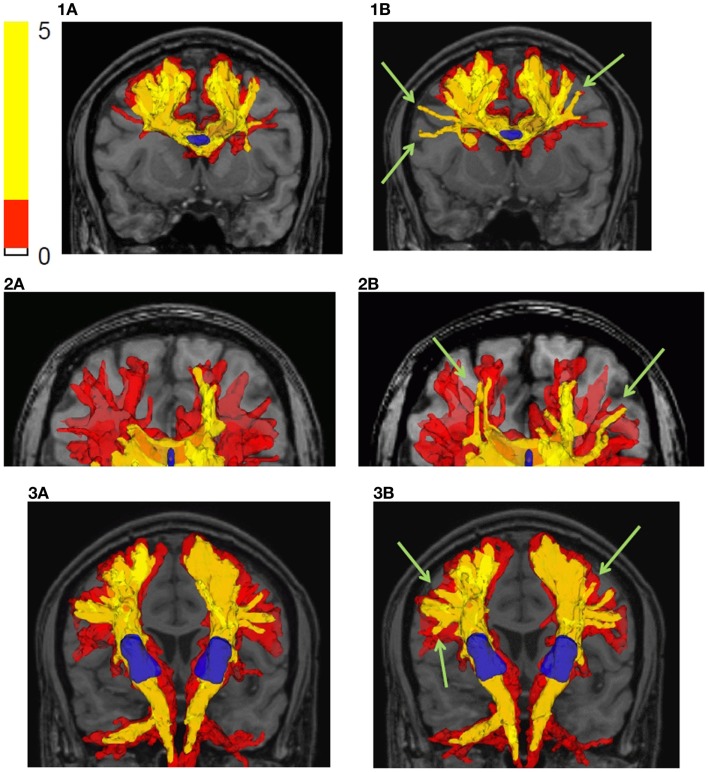
Figure 8.
Fiber tractography results in the human brain are shown. (a) Bootstrap probabilistic framework, no curve inference labeling; (b) bootstrap probabilistic framework and curve inference labeling of fanning fibers. The results are shown by plotting isosurfaces of the connectivity index map superimposed on the T1 weighted anatomical image. The translucent red surface is that encompassing the lowest non-zero connectivity index values, and the yellow surface is a higher isosurface of the connectivity index map (shown in legend). Row (1) is the result using a seed ROI in the center of the corpus callosum, row (2) is the result starting in the genu of the corpus callosum, and row (3) is the result using an internal capsule seed ROI. The reference ROIs are shown in blue.

