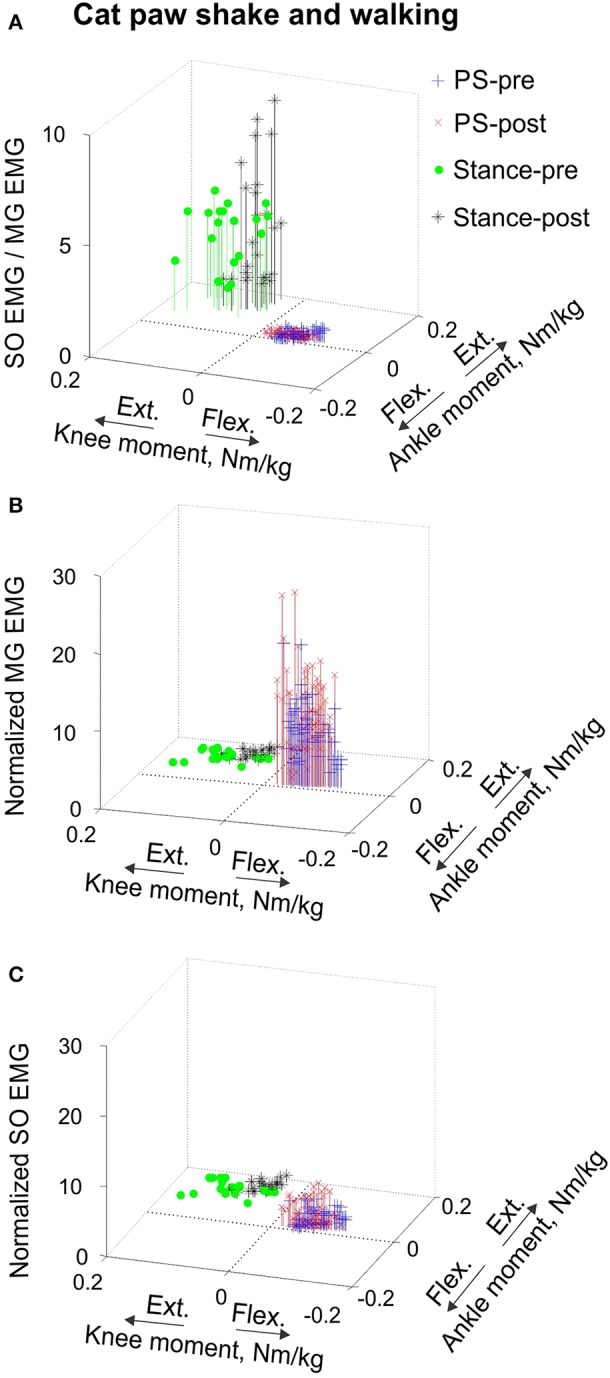
Figure 7.

Mean SO EMG/MG EMG ratio (A), mean normalized MG EMG activity (B) and mean normalized SO EMG activity (C) as functions of the mean normalized ankle and knee resultant muscle moments during paw shake responses and stance of walking in the cat. Each symbol corresponds to the mean normalized EMG activity plotted vs. the respective mean normalized ankle and knee moment in a given movement cycle. During paw shake responses, SO and MG EMG activity bursts occurred at the ankle extension-knee flexion joint moment combination (purple and red crosses designate paw shake cycles recorded pre and post SO-GA self-reinnervation; n = 62 and n = 62, respectively). During the stance phase of walking, SO and MG EMG bursts occurred at the ankle extension-knee extension joint moment combination (green circles and black stars correspond to stance phases recorded pre and post SO-GA self-reinnervation; n = 20 and n = 25, respectively).
