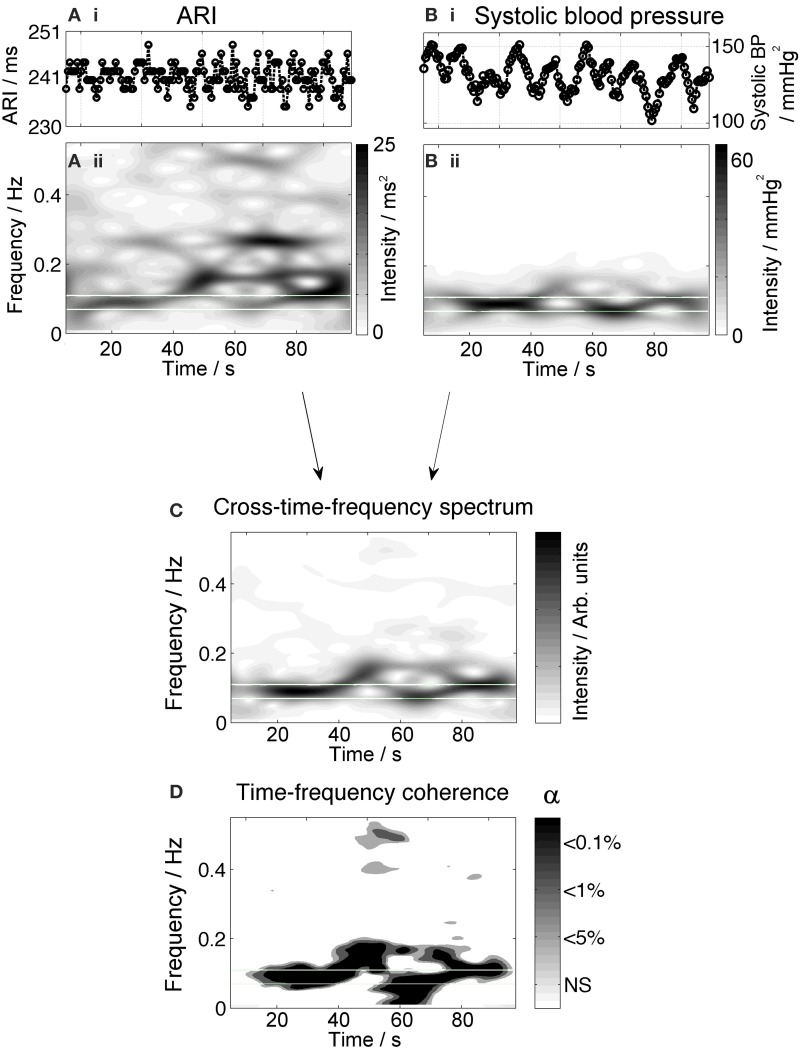
Figure 4.
Example measurements from one subject showing oscillatory behavior of ARI at the Mayer frequency. The upper panels (Ai,Bi) show the time series of ARI and blood pressure, respectively. Blood pressure shows prominent oscillation with a 10-s period; ARI shows oscillation at this rate as well as variation at higher frequencies. The corresponding time-frequency spectra, (Aii,Bii), show high-intensity bands highlighting the presence of waves at a Mayer wave frequency (0.1 Hz). The cross time-frequency spectrum (C) demonstrates that the ARI and blood pressure are correlated at the Mayer frequency and not at other frequencies of oscillation. The results of coherence analysis in the lower panel (D) show the coherence at the respiratory frequency is significant at p < 0.001, indicating that both signals are coupled at this frequency over most of the recording.

