Figure 2.
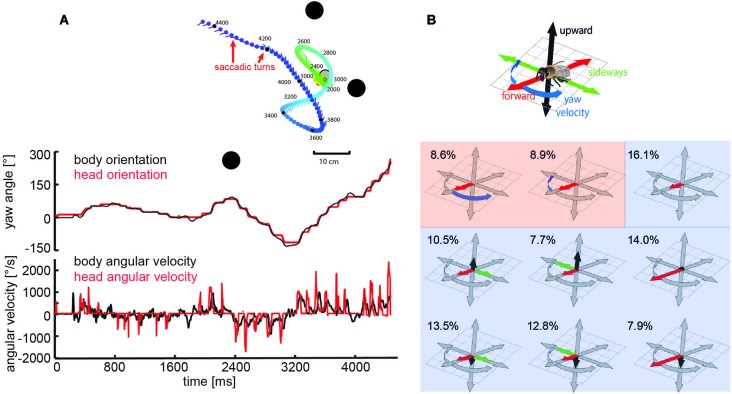
Saccadic flight strategy and variability of translational self-motion. Saccadic flight and gaze strategy of free-flying bumblebees and honeybees. (A) Inset: Trajectory of a typical learning flight of a bumblebee as seen from above during a navigational task involving landmarks (black objects). Each line indicates a point in space and the corresponding viewing direction of the bee’s head each 20 ms. The color code indicates time (given in ms after the start of the learning flight at the goal). Upper diagram: Angular orientation of longitudinal axis of body (black line) and head (red line) of a sample flight trajectory of a bumblebee during a learning flight after departing from a visually inconspicuous feeder surrounded by three landmarks. Note that step-like, i.e., saccadic direction changes are more pronounced for the head than for the body. Bottom diagram: Angular yaw velocity of body (black line) and head (red line) of the same flight (Boeddeker et al., submitted; Data from Mertes et al., 2014). (B) Translational and rotational prototypical movements of honeybees during local landmark navigation. Flight sequences while the bee was searching for a visually inconspicuous feeder located between three cylindrical landmarks can be decomposed into nine prototypical movements using clustering algorithms in order to reduce the behavioral complexity. Each prototype is depicted in a coordinate system as explained by the inset. The length of each arrow determines the value of the corresponding velocity component. Percentage values provide the relative occurrence of each prototype. More than 80% of flight-time corresponds to a varied set of translational prototypical movements (light blue background) and less than 20% has significantly non-zero rotational velocity corresponding to the saccades (light red background) (Data from Braun et al., 2012).

