Figure 4.
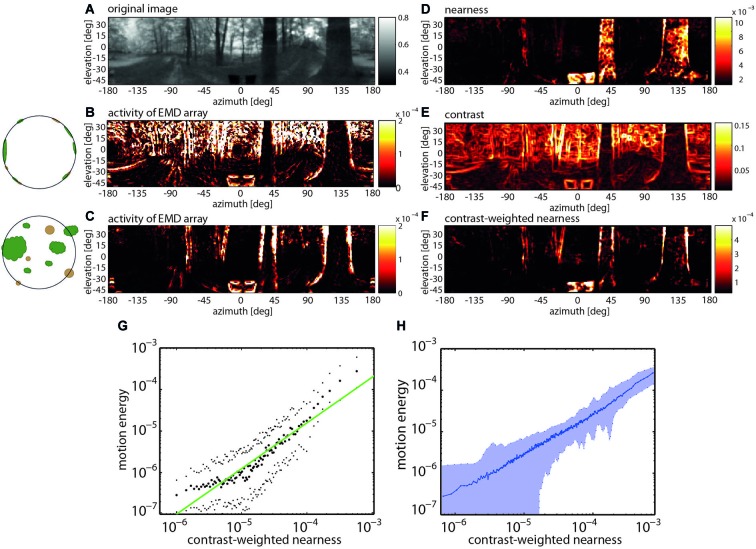
Representation of nearby contours by EMD arrays during translatory self-motion. (A) Panoramic input image with brightness adjusted to the spectral sensitivity of the motion detection system. (B) Activity profile of EMD array after equalizing the depth structure of the environment (see inset). (C) Activity profile of EMD array in response to translatory motion in environment with natural depth structure. (D) Nearness of environmental structures. (E) Local contrast of environmental structures. (F) Contrast-weighted nearness of environmental structures. (G) Relation between motion energy and the contrast-weighted nearness plotted in a double logarithmic way for the center of the track of the forest scenery shown in (A). (H) Relation between motion energy and the contrast-weighted nearness for 37 full-depth motion sequences recorded in a wide range of different types of natural environments (Data from Schwegmann et al., 2014).

