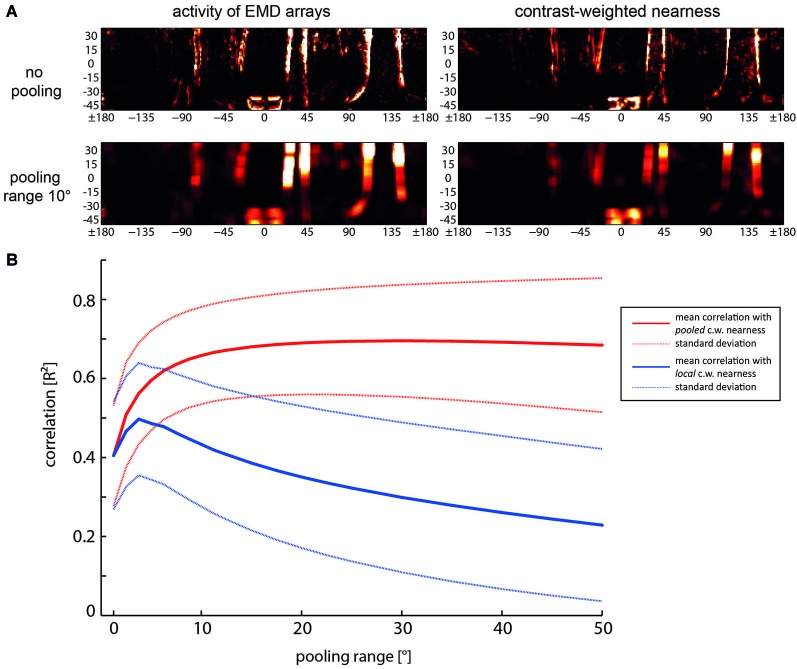
Figure 5.
Relationship between spatial pooling of local motion information, the reliability of representing nearby contours and their localizability. (A) Examples of activity distribution of EMD arrays (left) and contrast-weighted nearness map (right) for no pooling (the upper row) and for a pooling range of 10°, i.e., spatially integrating the output a square array 8 × 8 neighboring EMDs (bottom row). (B) Mean correlation (solid lines) and standard deviations (dashed lines) as a function of pooling range. Red lines: Correlation of the pooled motion energy profile with the pooled contrast-weighted (c.w.) nearness map. Blue line: Correlation of the pooled motion energy profile with local non-pooled contast-weighted nearness map, indicating the reduction of localizability with increasing pooling range (Data from Schwegmann et al., 2014).

