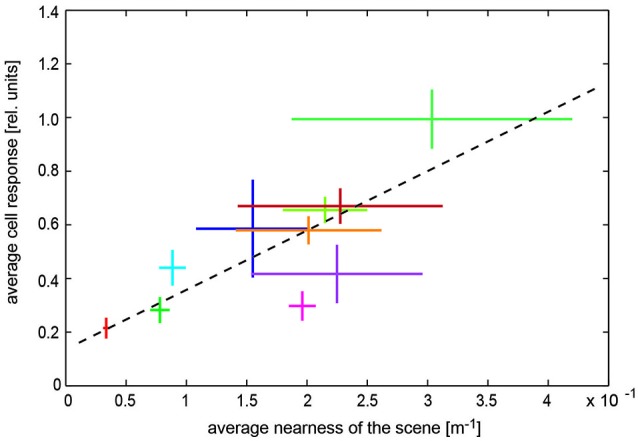
Figure 6.

Representation of spatial information by visual wide-field neurons. Dependence of blowfly LWC with large receptive field (H1 neuron) on overall nearness during translatory self-motion in various cluttered natural environments. Data obtained in different environments are indicated by different colors. Horizontal bars: Standard deviation of the “time-dependent nearness” during the translation sequence within a given scenery, indicating the difference in the spatial structure of the different environments. Vertical bars: Standard deviation of response modulations obtained during the translation sequence in a given scenery. Corresponding mean values are given by the crossing of the horizontal and vertical bars. Regression line (black dashed line) illustrating the relation between nearness values and cell responses (Data from Ullrich et al., 2014a).
