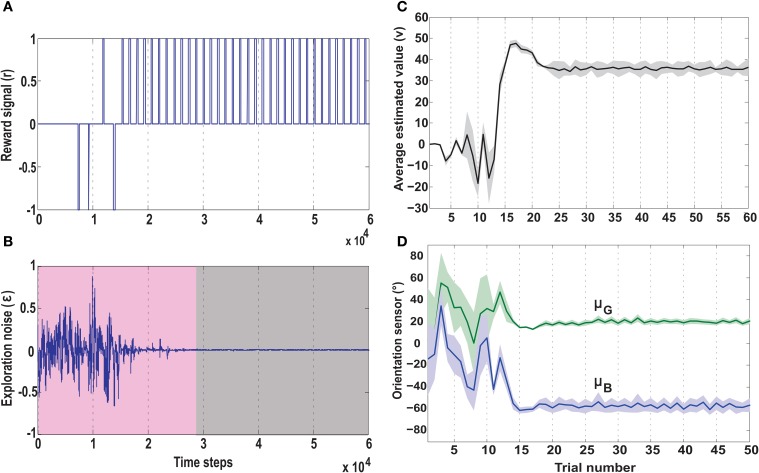
Figure 9.
Temporal development of key parameters of the actor-critic RL network, in the no obstacle foraging task. (A) Development of the reward signal (r) over time. Initially the robot receives a mix of positive and negative rewards due to random explorations. Upon successfully learning the task, the robot is steered toward the green goal every time, receiving only positive rewards. (B) Development of the exploration noise (ϵ) for the actor. During learning there is a high noise in the system (pink shaded region), which causes the the synaptic weights of the actor to change continuously. Once the robot starts reaching the green goal more often the TD error from the critic decreases leading to a decrease in exploration noise (gray shaded region), which in turn causes the weights to stabilize (Figure 7). (C) Average estimated value (v) as predicted by the reservoir critic is plotted for each trial. The maximum estimated value is reached after about 18 trials after which the exploration steadily decreases and the value function prediction also reaches near convergence at 25 trials (1 trial approximates 1000 time steps). The thick black line represents the average value calculated over 50 runs of the experiment with standard deviation given by the shaded region. (D) Plots of the two orientation sensor readings (in degrees) for the green (μG) and the blue (μB) goals, averaged over 50 runs. During initial exploration the angle of the deviation of the robot from the two goals changes randomly. However, after convergence of the learning rules, the orientation sensor readings stabilize with small positive angle of deviation toward the green goal and large negative deviation from the blue goal. This shows that post learning, the robot steers more toward the green goal and away from the blue goal. Here the thick lines represent average values and the shaded regions represent standard deviation.

