
FIGURE 3.
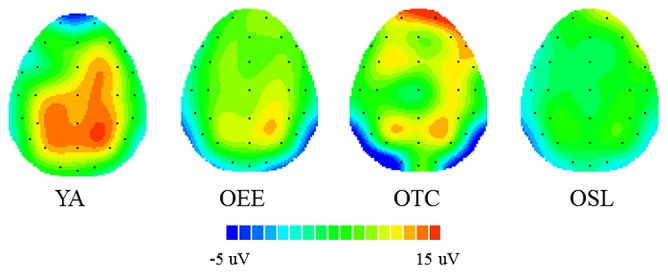
Topographical maps of the mean P3 voltage (300–550 ms) for the averaged homogeneous and heterogeneous conditions for the four groups.
Official websites use .gov
A
.gov website belongs to an official
government organization in the United States.
Secure .gov websites use HTTPS
A lock (
) or https:// means you've safely
connected to the .gov website. Share sensitive
information only on official, secure websites.
Topographical maps of the mean P3 voltage (300–550 ms) for the averaged homogeneous and heterogeneous conditions for the four groups.