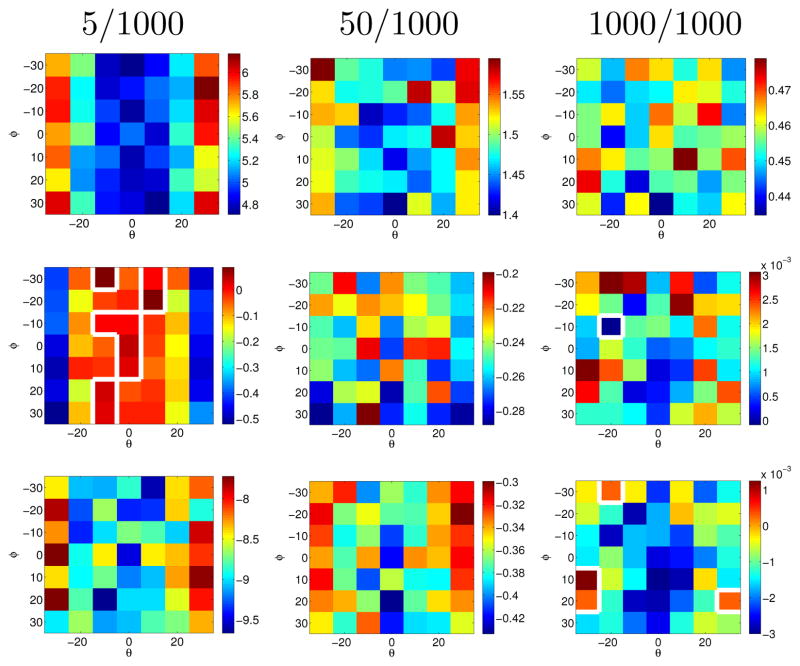
Fig. 3.
Synthetic experiments: Angle difference (in degrees) between the estimated normal vector and the ground truth. Top row: proposed method. Middle row: plane fit with prior without clustering error minus with clustering error. Bottom row: plane fit without prior error minus plane fit with prior with clustering error. Estimates are results of 1000 random samples for different priors and varying numbers (5/1000, …) of points in the two stain clusters. The proposed method performs best. The white line shows the zero level set of angle differences.

