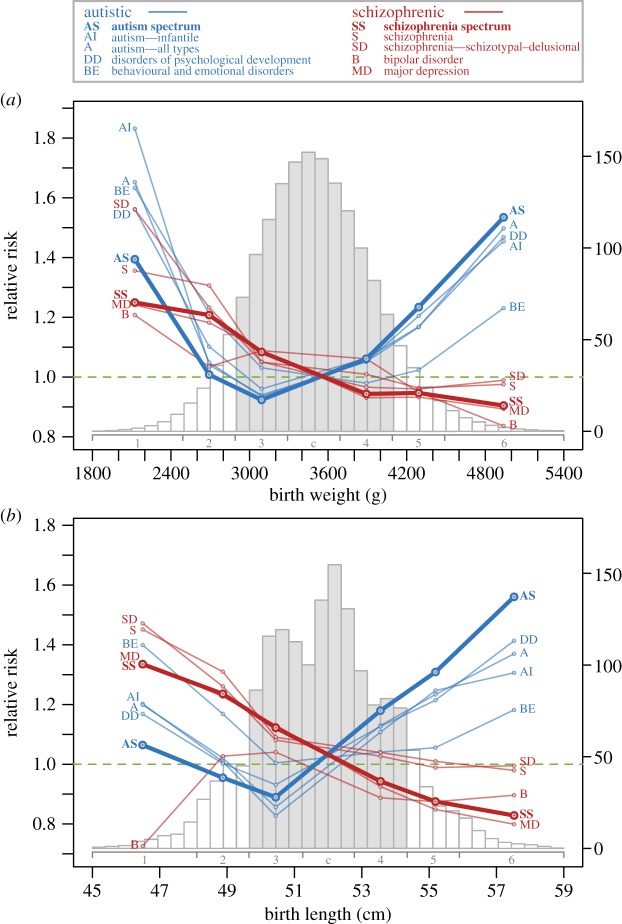
Figure 3.
Risk of AS and SS disorders by birth weight (a) and birth length (b). Points show relative risks (RRs) obtained from Cox regression for each disorder (see the electronic supplementary material, table S4, for corresponding risk ratios, confidence intervals and p-values). Risk for other disorders related to AS and SS are also shown. Grey histogram bars represent the majority of birth data within approximately ±1 s.d. of the mean, including groups 3 (2891–3290 g or 49.7–51.2 cm), central (3291–3690 g or 51.3–52.7 cm) and 4 (3691–4090 g or 52.8–54.3 cm). Smaller babies beyond ±1 s.d. included groups 1 (1850–2490 g or 45–48.0 cm) and 2 (2491–2890 g or 48.1–49.6 cm). Larger babies included groups 5 (4091–4490 g or 54.4–55.9 cm) and 6 (4491–5400 g or 56.0–59 cm). Histograms represent birth weight and length distributions by frequency (×1000) on the right y-axis.

