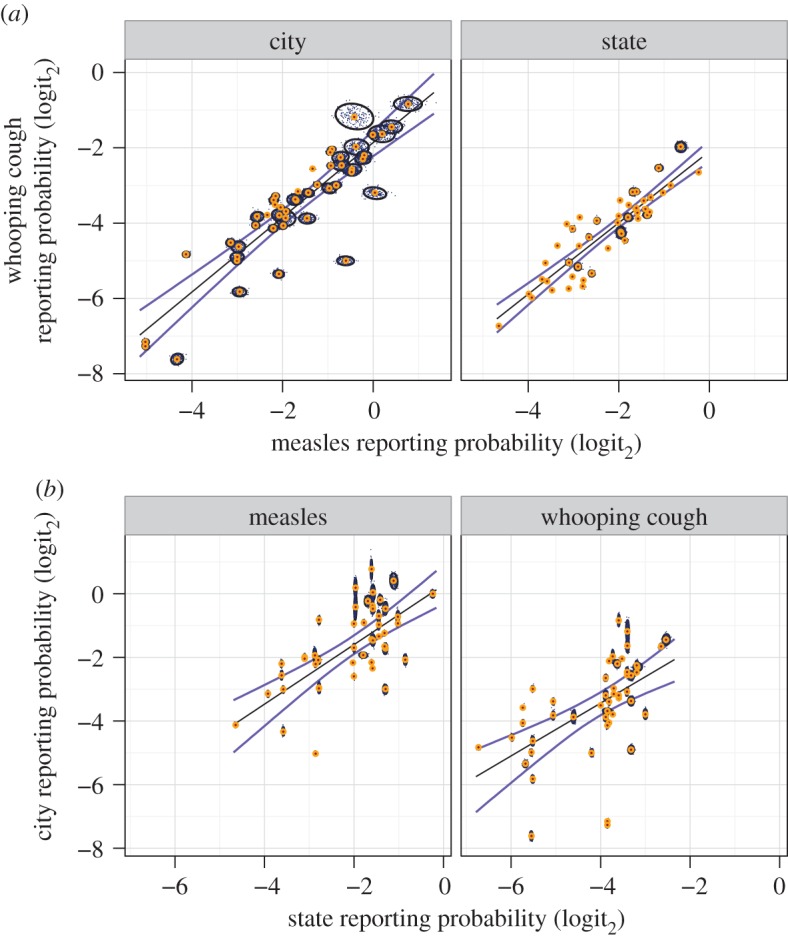
Figure 2.

Comparison of reporting probability estimates (microdata method). (a) Within-area comparison, showing close covariation between diseases. (b) Within-disease comparison, showing covariation between areas. Variability between locations (i.e. cities or states) greatly exceeds variability within locations. 104 total bootstraps were drawn (200 are plotted, small black points). For each sampled comparison, an approximate 95% confidence interval (CI) (black ovals) and median probability (orange central dot) are shown, along with median linear models (black line) and approximate model 95% CI (blue lines). See the electronic supplementary material, table S2, for linear model results.
