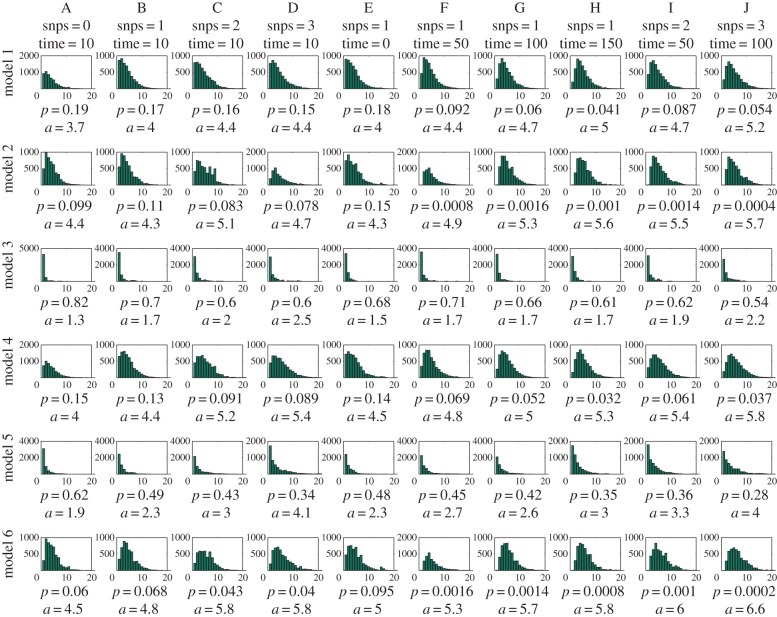
Figure 2.
Histogram approximations to the posterior predictive distribution for transmission links. Each column corresponds to a different case of isolates and each row to a different observation model. Below each histogram, we show the estimated probability of direct transmission (p) and the posterior mean for transmission links (a).

