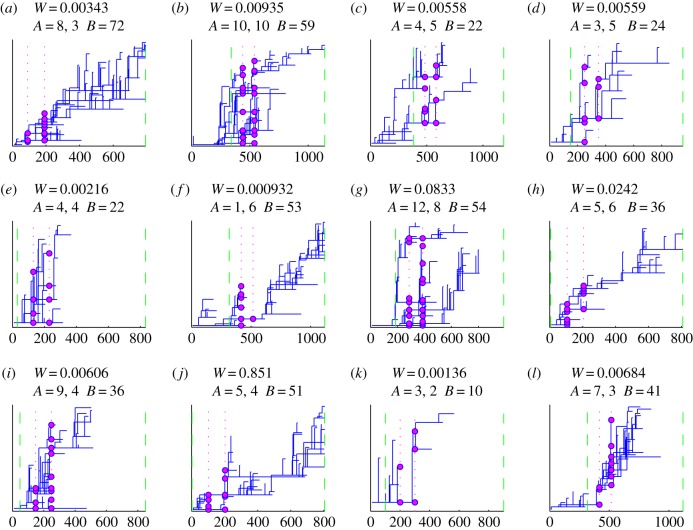
Figure 3.
An illustration of the posterior distribution of transmission trees for a pair of isolates having two-SNP distance of one and being observed 100 days apart from each other. The normalized weights of the 12 sampled trees are shown above each tree. We also show the number of branches alive at the first and second observation time (A) and the total number of branches born during the follow-up (B). In each panel, time origin was set to the time of the most recent common ancestor. Relative to that, vertical green lines mark the start and the end of the follow-up, and the lines and spheres in magenta show the branches alive at the two observation times.

