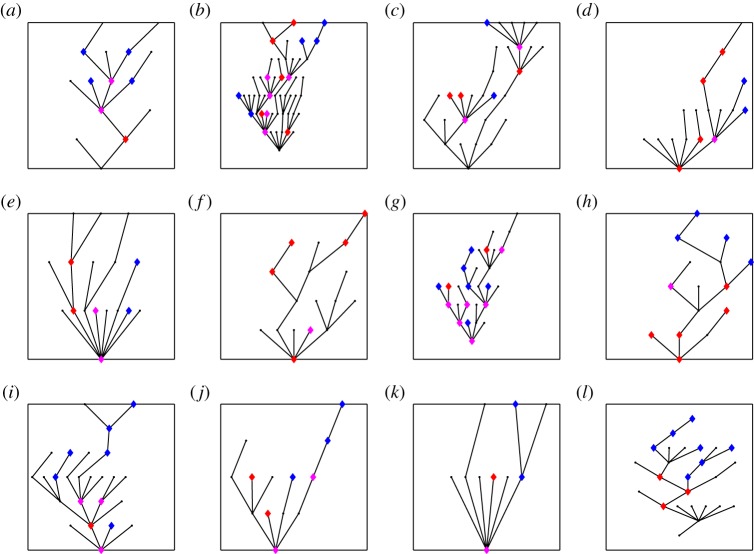
Figure 4.
The topology of the subtree tree connecting the branches alive at observation times, for the same trees as shown in figure 3. We show the branches alive at first observation time in red, at both observation times in magenta and at the second observation time in blue.

