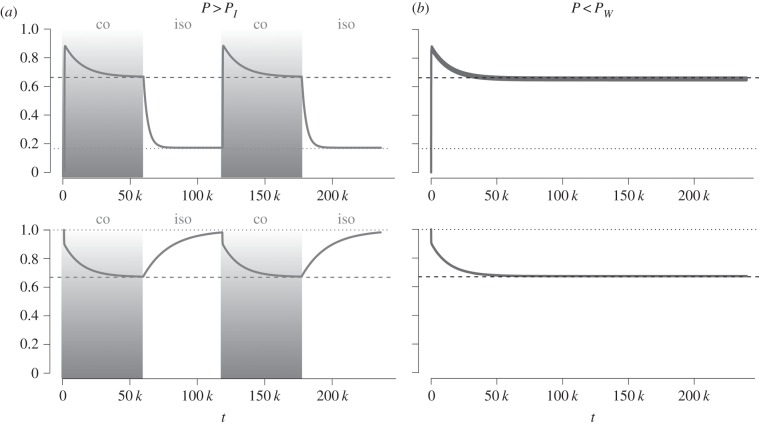
Figure 1.
Trajectories of within- (hs) and between-population (hb) genetic diversities under cycles of isolation and connection: (a) in the long-period domain P > PI and (b) in the short-period domain P < PW. The dashed and dotted lines represent the expected equilibrium value when populations are connected and isolated, respectively. In (a), both hs and hb reach their expected equilibrium value at the end of each connection and isolation period. In (b), both hs and hb tend to their equilibrium value of connection (dashed line) with very small fluctuations. Parameters are M = 40, n = 10, N = 2 000, μ = 2.5 × 10⁻⁵. (a) P = 60 000, (b) P = 150.

