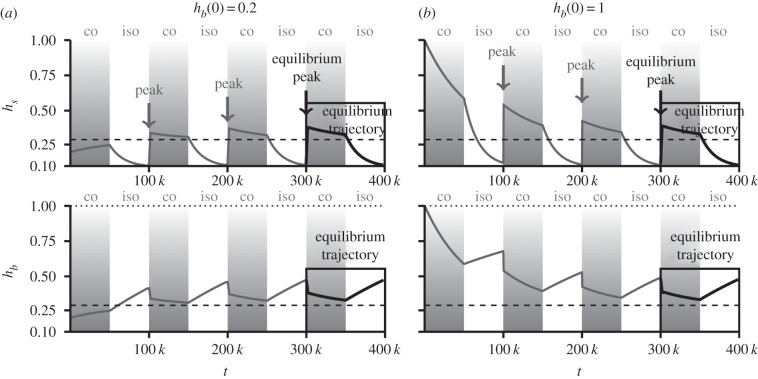
Figure 2.
Trajectories of within- (hs) and between-population (hb) genetic diversities under cycles of isolation and connection in the domain PW < P < PI when initial genetic diversity hb(0) is (a) low and (b) high. In (a), when hb(0) is low, the successive peaks of within-population genetic diversity (grey arrows) increase in size, while in (b) they decrease in size. In both (a) and (b), the equilibrium trajectories of genetic diversity (framed by a rectangle) are the same. Parameters are M = 400, θ = 0.1 n = 4, N = 10 000, P = 50 000 generations.

