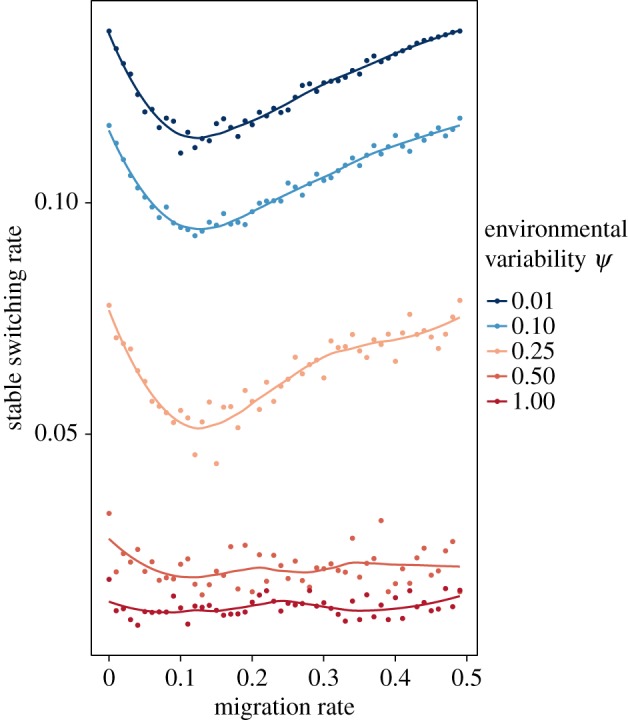
Figure 2.

The stable switching rate when selection is symmetric in space and time. All selection coefficients are 0.1. The expected time before an environmental change is 10 generations in both demes, and the colours correspond to different levels of environmental variability ψ. Environmental variability ψ = 0 corresponds to the exact periodic case of an environmental switch every 10 generations. Environmental variability ψ = 1 represents the case where both environments change with an exponential waiting time of 10 generations. The plotted curves are fitted to the data using a generalized additive model with penalized cubic regression splines.
