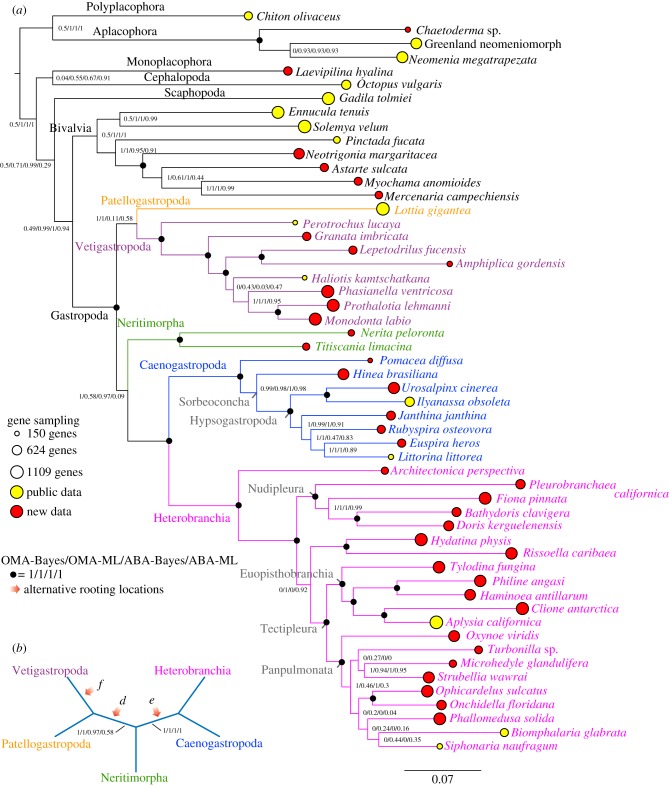
Figure 3.
Summary tree for analyses of Supermatrices 1. (a) Rooted phylogram of the maximum-likelihood OMA analysis, including outgroup taxa. Branch support values are shown on descendent nodes. The areas of the lollipops, which are centred on the branch tips, are proportional to the number of genes sampled in OMA Supermatrix 1. (b) Unrooted cladogram of the ingroup taxa. Branch support values are shown, and alternative rooting locations are indicated with orange arrows. These support values were calculated by removing the outgroup taxa from the tree sets used to generate (a) and regenerating consensus trees. The letter on the rooting arrow corresponds to the hypotheses shown in figure 1.

