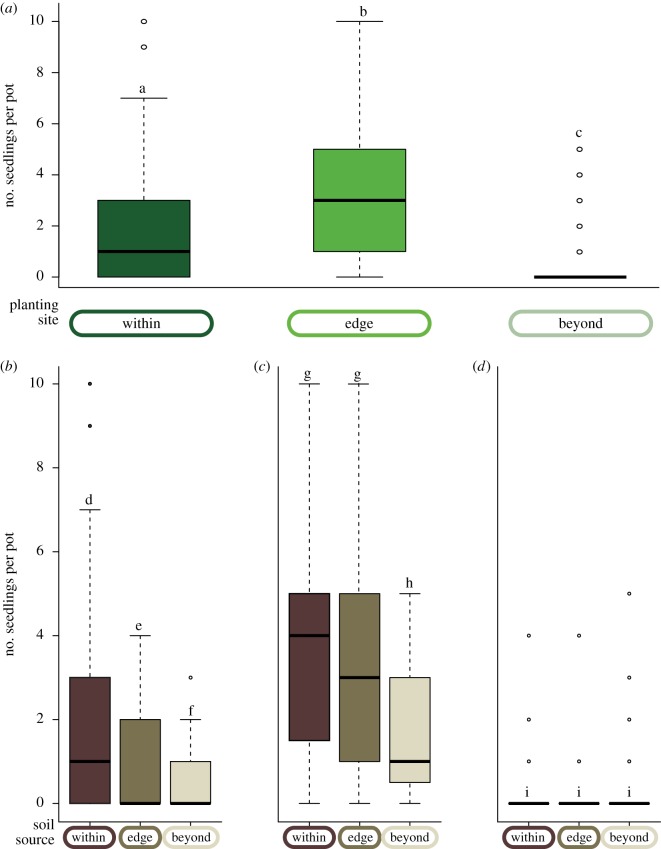
Figure 2.
Seedling regeneration response to elevation and soil source. Number of seedlings per pot by (a) planting site, regardless of soil source, and planted at sites (b) within, (c) at the edge and (d) beyond sugar maple's natural distribution, separated by soil source. The number of seedlings represents those individuals that survived beyond initial germination and persisted into late July during the first year of recruitment. Boxes here, and in subsequent figures, show the 25–75% quartiles of the data, with the median indicated by the line through the centre of the box. Whiskers extending from the box represent the 95% quartiles, and extreme observations are shown as hollow circles. Different letters over boxes within a single panel indicate statistically significant differences between treatments at α = 0.05 level. Note that these graphs summarize raw data, while significant differences were tested after accounting for transect and block effects. (Online version in colour.)

