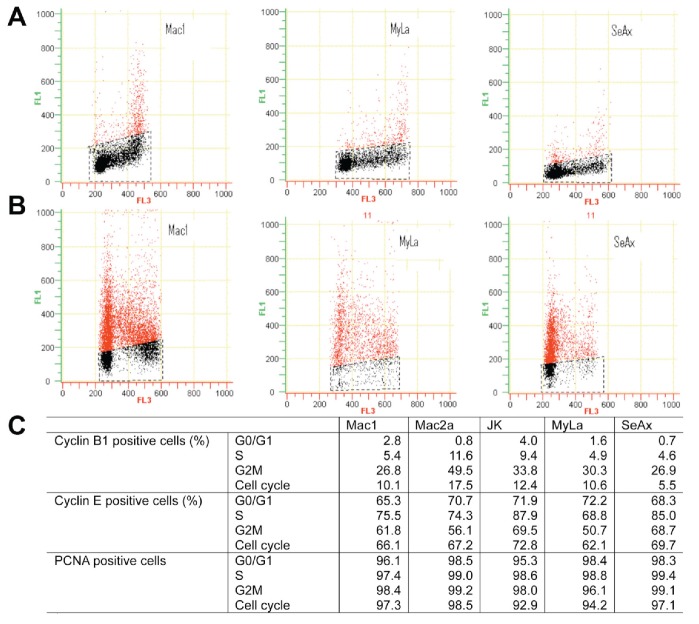
Figure 2.
Cyclin B1 and cyclin E expression in cutaneous T-cell lymphoma cell lines. Cells (2×10⁶) were washed in PBS and fixed in ice-cold 70% ethanol for at least 20 hr. Subsequently, cells were washed again, permeabilized using 0.25% Triton-X 100 (5 min) and stained using appropriate antibodies. In the case of cyclin B1 and PCNA staining, primary FITC labeled antibodies were used (diluted 1:50; BD Pharmingen™) for 2 hr. In the case of cyclin E, cells were stained with primary mouse anti-human cyclin E antibodies (1:150; BD Pharmingen™) for 1 hr, followed by 1 hr treatment with secondary goat anti-mouse antibodies labeled with Alexa-Fluor 488 (1:1000; Invitrogen). In all cases the appriopriate isotype control (for direct staining) or secondary control (for indirect staining) was used. DNA was stained with 7-amino-actinomycin D (7AAD; Beckman Coulter). Cellular fluorescence was measured using flow cytometer (Beckman Coulter). Total percentage of positive cells and percentage per cell cycle phase were calculated. Flow cytometry diagrams show cyclin B1 (A) and cyclin E (B) staining in Mac1, MyLa, and SeAx cells. Quantification of flow cytom etry data is shown in (C).

