Figure 1.

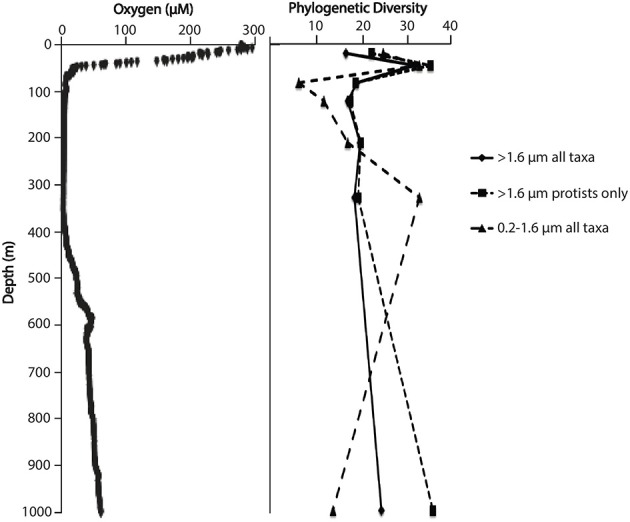
Dissolved oxygen concentration and phylogenetic diversity as a function of water column depth. Diversity data points are mean values based on rarefaction of OTU counts at a standardized sequence count (n = 1308 per sample).

Dissolved oxygen concentration and phylogenetic diversity as a function of water column depth. Diversity data points are mean values based on rarefaction of OTU counts at a standardized sequence count (n = 1308 per sample).