Figure 1.
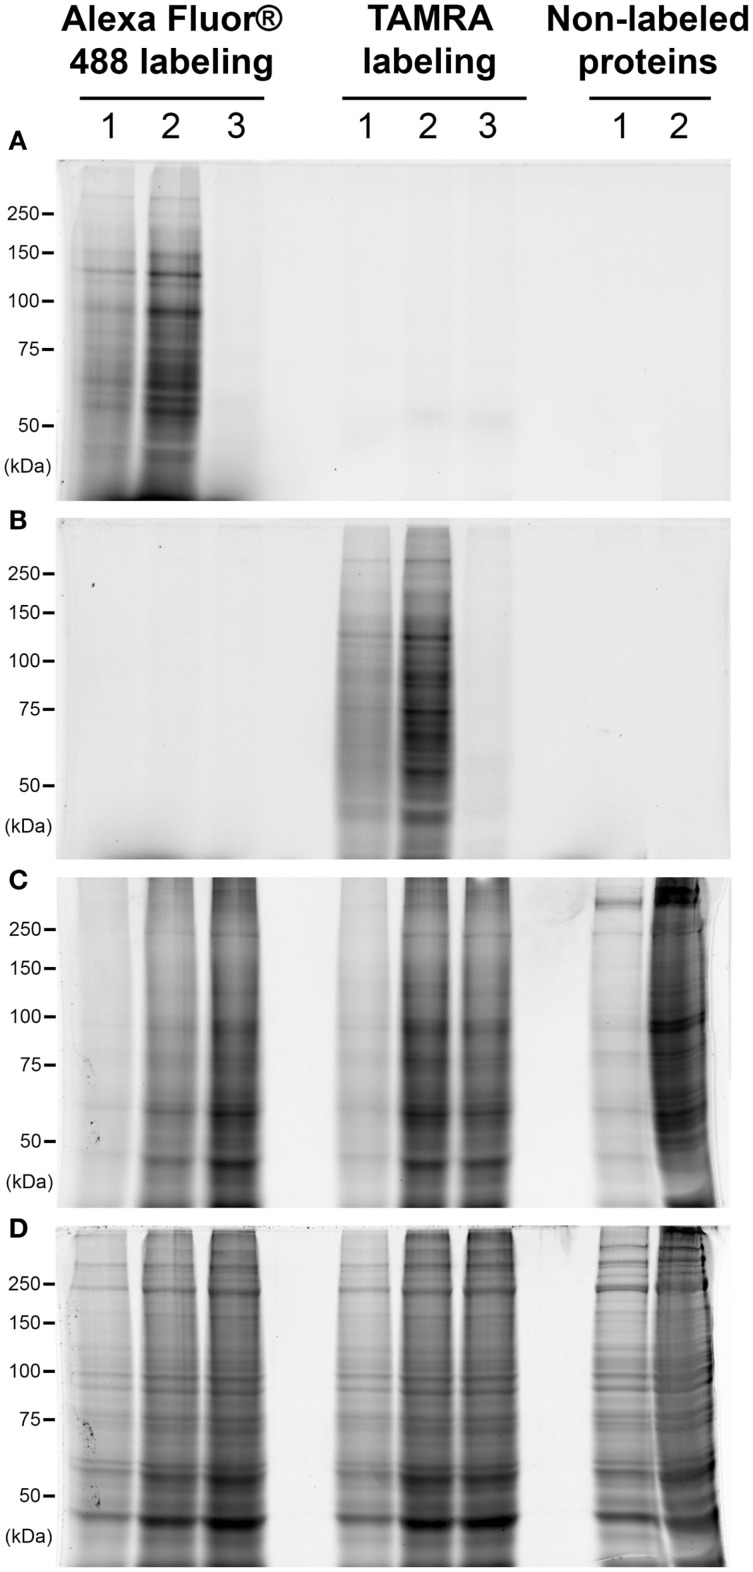
Comparison of the labeling with TAMRA or Alexa Fluor® 488. Proteins corresponded to 25 or 100 μg of whole cellular extract (lanes 1 and 2, respectively) were labeled with galactosyltransferase and coupled with two different fluorophores: Alexa Fluor® 488 or TAMRA. In each case, the same protocol was applied on 100 μg of proteins but omitting the galactosyltransferase, corresponding so to non-labeled proteins (lane 3). Proteins were then separated on a 7.5% SDS-PAGE, and fluorophores detection was done at the end of the electrophoresis. Gel was then fixed and successively stained with the ProQ Diamond and Sypro Ruby. Images acquisition was performed sequentially after each staining. All acquisitions were done using the Chemidoc MP imager. (A) Blue epi-illumination was applied on the gel to detect the Alexa Fluor® 488-labeled proteins. (B) Green epi-illumination was applied on the gel to detect the TAMRA-labeled proteins. (C) Green epi-illumination was applied on the gel to detect the phosphorylated proteins after the ProQ Diamond staining. (D) Red epi-illumination was applied on the gel to detect the whole proteins extract after the Sypro Ruby staining.

