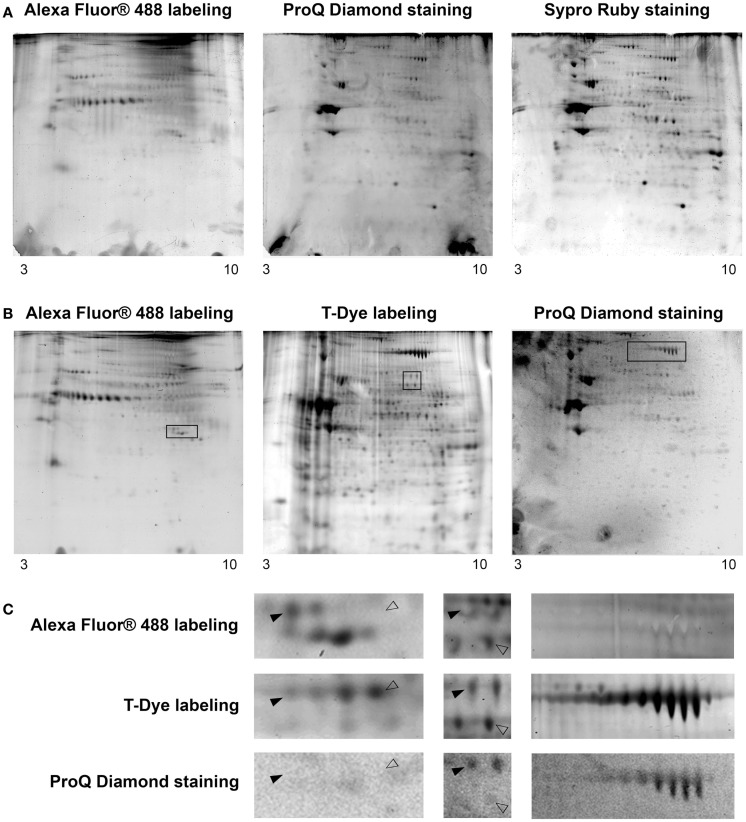
Figure 4.
Cartographies of the O-GlcNAcome, the phosphoproteome, and the whole proteome within the same gel. Five hundred micrograms of cytosol-enriched extract were resolved on bidimensional gel electrophoresis; isoelectrofocalisation was done on non-linear 3–10 IPG dry strip, while second dimension was performed on 8.5% resolving gel. The O-GlcNAcome was detected through Click chemistry and Alexa Fluor® 488. The phosphoproteome was imaged after ProQ Diamond staining. The whole proteome was visualized through two approaches: the Sypro Ruby staining, or the T-Dye labeling. (A) This workflow corresponded to O-GlcNAcome imaging, followed by ProQ Diamond and then Sypro Ruby staining. (B) This workflow corresponded to O-GlcNAcome imaging, in parallel of whole proteome imaging through T-Dye labeling; the phosphoproteome was then investigated using the ProQ Diamond staining. (C) Zoom of zones of interest squared on gels from previous panel. Plain or blank arrows indicated proteins differentially detected on O-GlcNAcome, phosphoproteome, or whole proteome images, corresponding so to proteins bearing or not O-GlcNAc and/or phosphate moieties.

