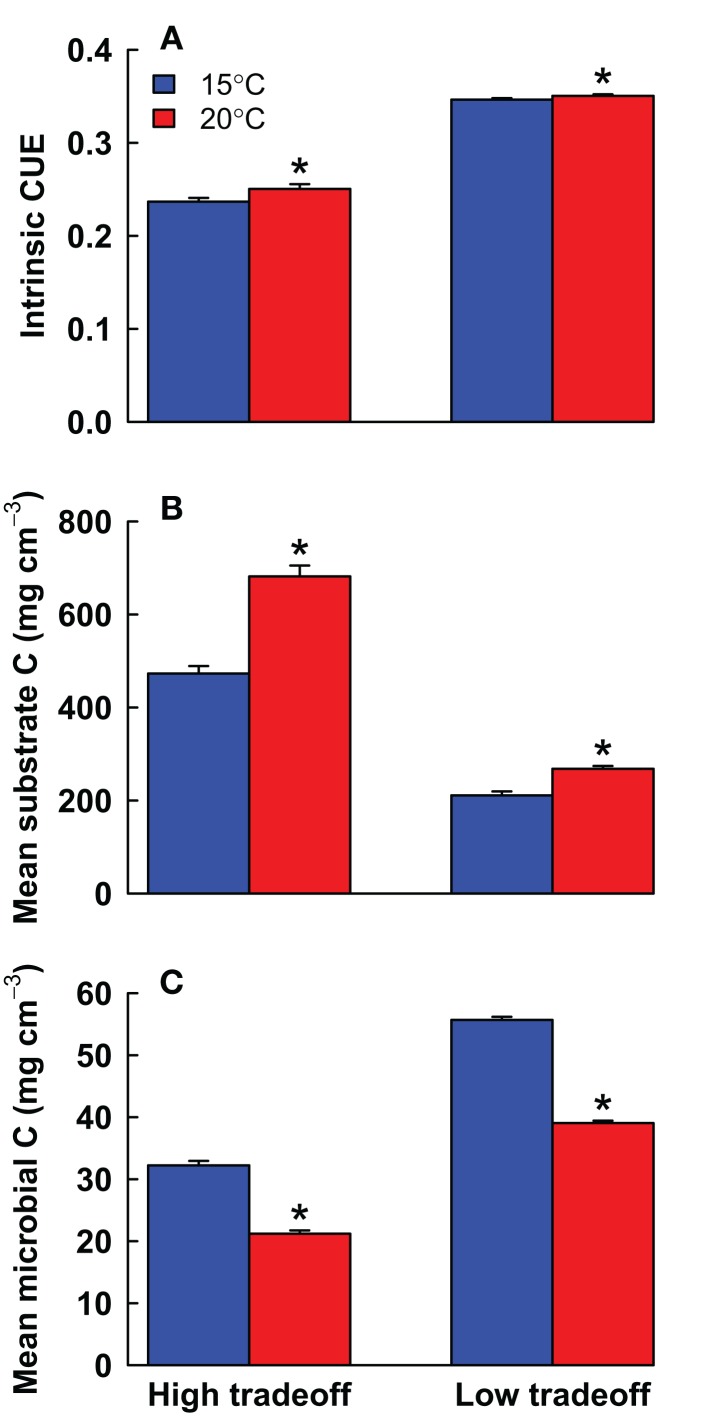
Figure 2.
Mean ± SE (A) intrinsic carbon use efficiency (CUE), (B) total substrate carbon, and (C) total microbial biomass carbon under high and low tradeoff scenarios at 15 vs. 20°C in the DEMENT model. Significant differences between temperatures are noted with an asterisk (P < 0.01, paired t-test).

