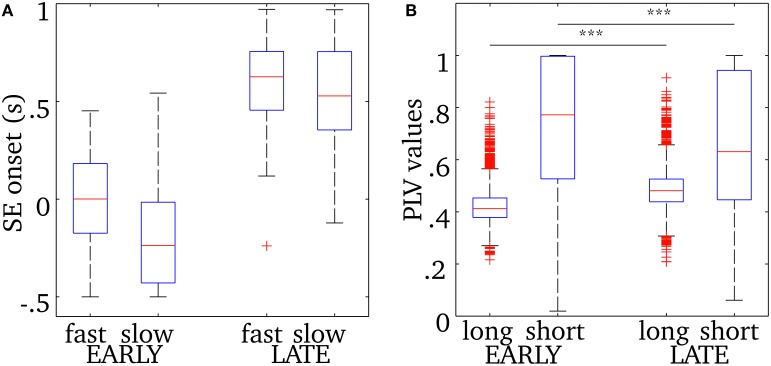
Figure 6.
(A) Onset time descriptive statistics (median, quartiles, and extrema) for early or late events, with fast or slow oscillations, relative to the time of spindle onset defined on the EEG at Cz. (B) Phase-locking value descriptive statistics for long-range and short-range synchrony displayed for both early (columns 1, 2) and late (columns 3, 4) synchronous events. The horizontal bar and asterisks indicate a statistically-significant difference with p < 0.001 (see text for details). The number of points in the distributions of short-range PLV (source pairs) and long-range PLV (region pairs) are respectively 3,053,790 and 3828. See text for how events were classified.

