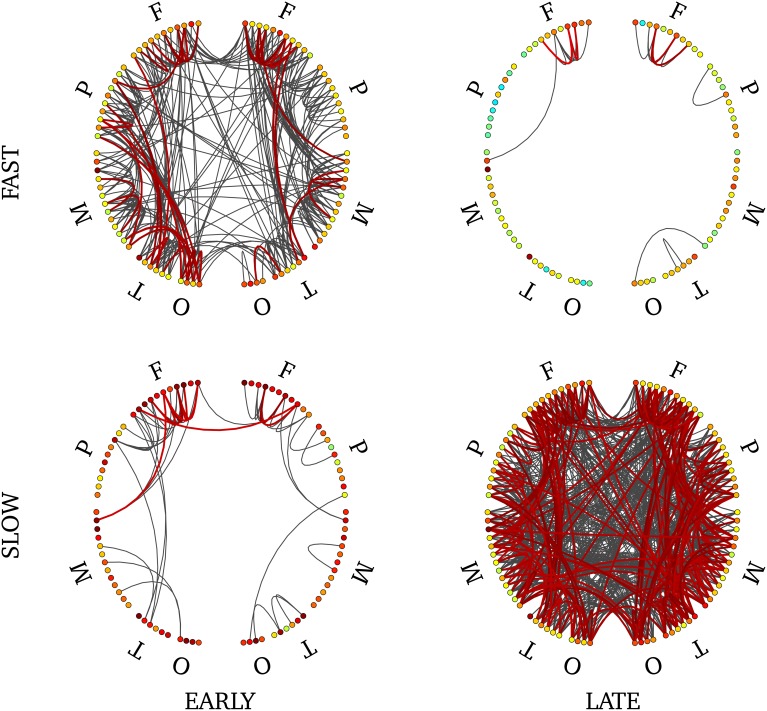
Figure 9.
Connectivity profile associated with early fast (upper left), early slow (bottom left), late fast (upper right) and late slow (bottom right) SEs. Non-parametric FDR thresholding was applied to inter-regions PLV values and significant PLVs are displayed with thick lines. Visualization threshold was set to 0.8 and non-significant links are displayed with thin gray lines. Left and right halves of each plot reflect separate hemispheres, each consisting of 5 main divisions (F, frontal; P, parietal; M, mesial; T, temporal; O, occipital). Node colors reflect intra-region synchrony (no threshold applied).

