Fig. 4.
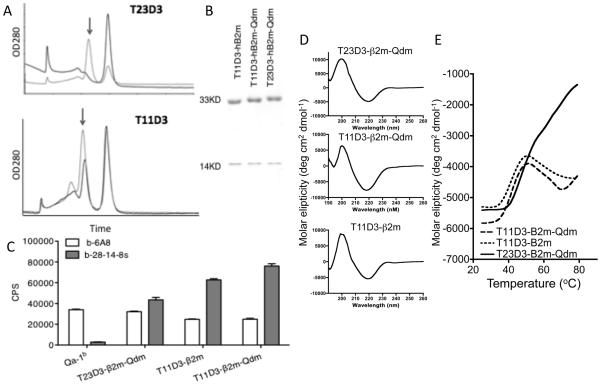
In vitro folding of the hybrid T11D3 and T23D3 molecules. (A) S300 spectrum of the folding products. Arrows indicate the correct folding product peak. Top panel: black line, T23D3-β2m folding, gray line, T23D3-β2m-Qdm folding; bottom panel: T11D3-β2m folding, black line, T23D3-β2m folding, gray line, T11D3-β2m-Qdm folding. (B) SDS-PAGE analysis of the purified folding products. The MHC heavy chain is ~33kD and the β2m light chain is −14kD. (C) Eu-based immunoassay to examine the folding products. Folding MHC monomer was captured by the anti-β2m mAb and detected by biotinylated 28-14-8s and 6A8 (b-28-14-8s and b-6A8). The assay was set up in triplicates (n=3) and the experiment was repeated twice with similar results. One of them was shown.
(D) In vitro folded MHC monomers were analyzed using far-UV circular dichroism. Each spectrum curve was the average of three independent scans, and a representative one was shown.
(E) Thermal denaturation curves were generated from CD signals recorded at 222nm and the temperature was increased at 2°C interval from 25°C to 79°C. Each curve presented the average of three independent experiments.

