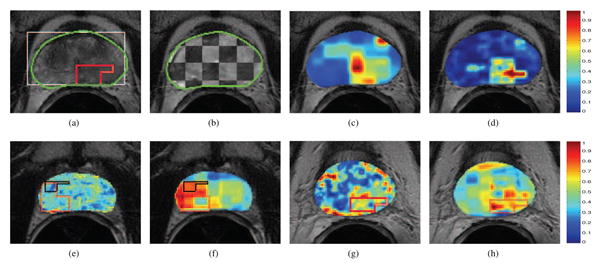
Fig. 2.

(a) Pre-RT T2w MRI image, with bounding box initialization to the segmentation algorithm in white (from MRS) and final prostate boundary delineation result shown in green. The red outline corresponds to the radiologist annotated CaP extent for this image. (b) Checkerboard overlay of aligned and within the prostate ROI (outlined in green) showing accurate registration of pre- and post-RT T2w MRI data. CAD results via (c) (Ach + Acr)/Aci ratios, (d) integrated multi-parametric MRI information (red corresponds to a higher probability of CaP presence). Note high accuracy and specificity of (d) when compared to red outline in (a). Difference (L1 norm) heatmaps shown for 2 different studies, using (e) T2w intensity, (f), (h) Ach/Acr ratio, and (g) ADC values; taken between pre- and post-RT data. Red corresponds to areas of most change, blue corresponds to areas of least change, while the pre- and post-RT CaP extents (if any) are outlined in red and black respectively. In (e) residual CaP post-RT shows no change in T2w MR intensity (deep blue region within the black outline). Note that in (f), (g), (h) area of significant change in the heatmap corresponds to the successfully treated CaP region post-RT (red outline).
