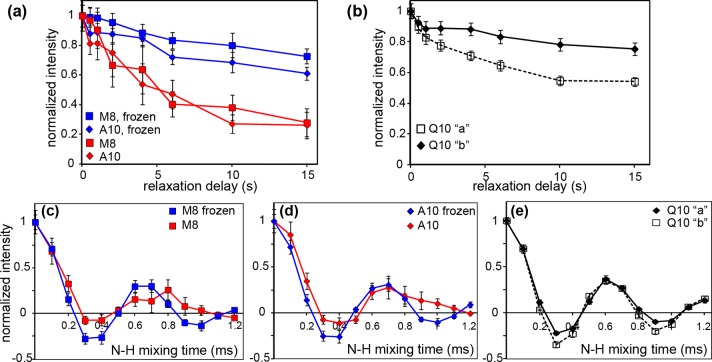
Figure 5.
Dynamics measurements. (a and b) 15N longitudinal relaxation for (a) residues in the httNT α-helix of httNTQ30P10K2 and (b) residue Q10 of the polyQ amyloid core of K2Q11PGQ11D2. (a) Relaxation curves are shown for the unfrozen sample (red) and frozen sample (blue). (b) 15N longitudinal relaxation curves at 275 K for conformers “a” and “b” of Q10 in unfrozen polyQ peptide K2Q11PGQ11D2 (described in ref (48)). Data were obtained as 1D 15N spectra at 19–22 kHz MAS. (c and d) N–H dipolar recoupling curves for M8 and A10 in the httNT of httNTQ30P10K2 fibrils, obtained on unfrozen (287 K, red) or frozen (250 K, blue) samples, respectively. (e) N–H coupling measurements of the polyQ amyloid core, showing separate curves for both conformers of the uniformly 13C- and 15N-labeled residue Q10 in unfrozen (275 K) fibrillar K2Q11PGQ11D2. Panels c–e used an R1817 symmetry sequence at 10 kHz MAS. All data were acquired at 600 MHz (1H).

