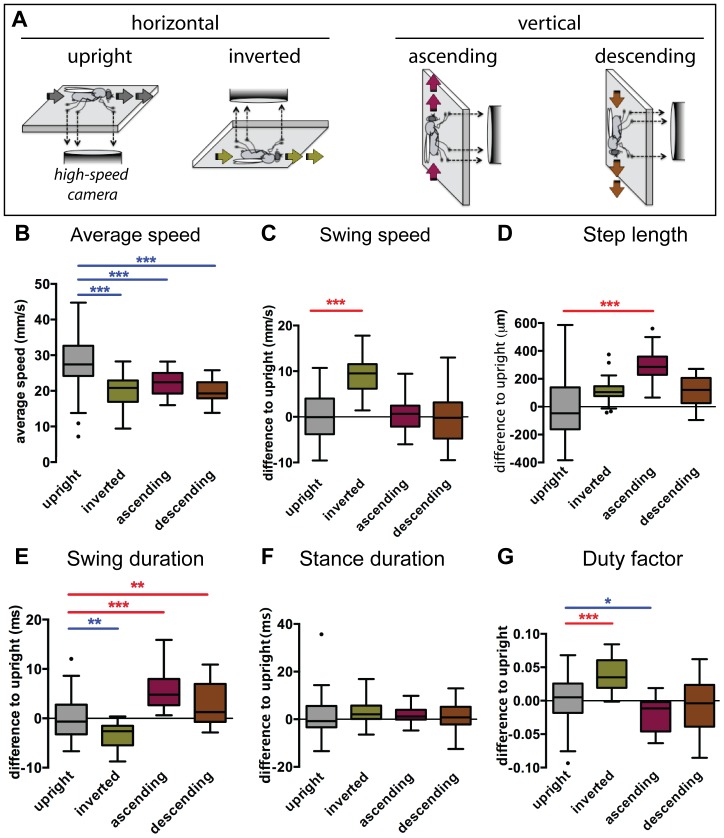
Figure 1. Imaging setup and step parameters.
(A). Schematic of the recording setup. The fTIR apparatus was oriented in order to allow the flies to walk freely inside a walking chamber either horizontally (upright or inverted) or vertically (ascending or descending). A high-speed camera recorded body and tarsal contacts on the optical glass, see [39] for details. Fly schematic adapted from [73]. (B–G) Boxplots represent the median as the middle line, with the lower and upper edges of the boxes representing the 25% and 75% quartiles, respectively; the whiskers represent the range of the full data set, excluding outliers. Circles indicate outliers. Grey represents upright controls (n = 71, from [39]), green for inverted (n = 28), purple for ascending (n = 28) and brown for descending (n = 23). For C–G data was residual normalized and expressed as the difference to the upright control. Statistical analysis with one-way ANOVA followed by Tukey’s post hoc test (for normal distributions in panels B, C and E) or Dunn’s post hoc test (for non-normal distribution in panels D, F and G), * P<0.05; ** P<0.01; *** P<0.001. Statistically significant increases or decreases are indicated in red and blue, respectively. (B) Non-upright animals display significantly reduced walking speed. (C) Swing speed was significantly increased in inverted walking animals. (D) All non-upright animals display increased step length. (E) Swing duration is increased only in ascending and descending animals while inverted animals show a small decrease. (F) Stance duration remains unchanged for all conditions. (G) Duty factor strongly increases in inverted walking animals while it is minimally reduced in ascending animals.

