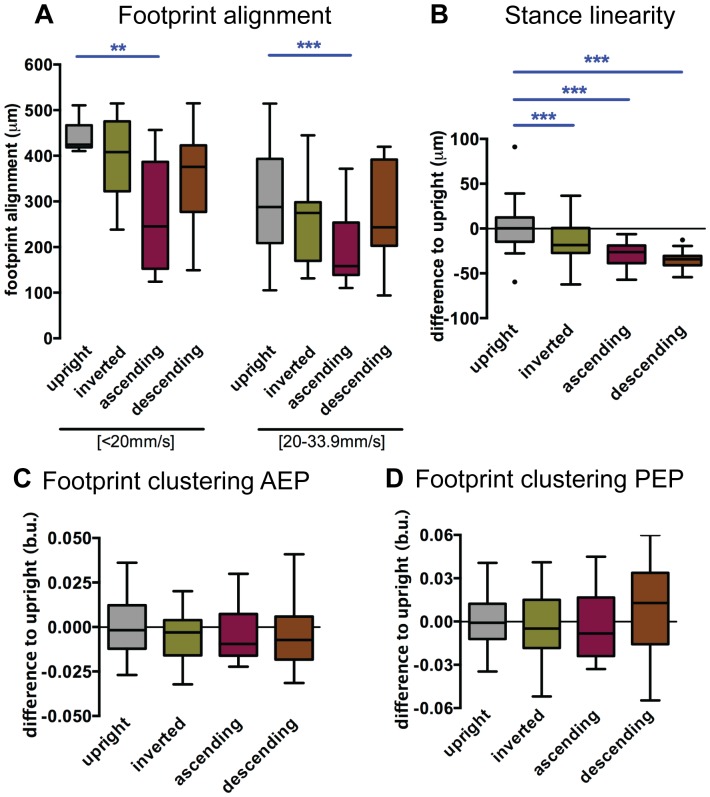
Figure 2. Spatial parameters.
Non-upright walking animals display more aligned footprints and less jitter during stance phases, while clustering remains unchanged. (A–D) Boxplots represent the median as the middle line, with the lower and upper edges of the boxes representing the 25% and 75% quartiles, respectively; the whiskers represent the range of the full data set, excluding outliers. Circles indicate outliers. Statistical analysis with one-way ANOVA followed by Tukey’s post hoc test, * P<0.05; ** P<0.01; *** P<0.001. Statistically significant decreases are indicated in blue. In B, C and D data was residual normalized and expressed as the difference to the upright control. (A) Ascending animals show more aligned footprints. Data were grouped into slow (<20 mm/s) and medium (between 20 and 34 mm/s) speeds. (B). Non-upright animals display lower values for stance linearity indicating lower jitter during stance phases. (C–D) Footprint clustering remains unchained for Anterior Extreme Position (AEP) and Posterior Extreme Position (AEP). (b.u., body units).

