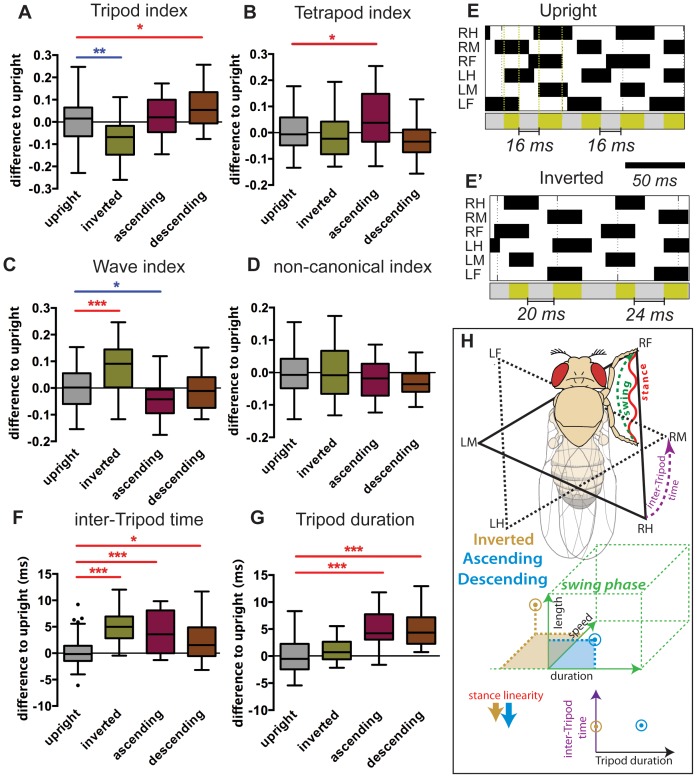
Figure 3. Interleg coordination parameters and summary of kinematic effects in non-upright walking animals.
(A–D, F–G) Boxplots represent the median as the middle line, with the lower and upper edges of the boxes representing the 25% and 75% quartiles, respectively; the whiskers represent the range of the full data set, excluding outliers. Circles indicate outliers. Data was residual normalized and expressed as the difference to the upright control. Statistical analysis with one-way ANOVA followed by Tukey’s post hoc test, * P<0.05; ** P<0.01; *** P<0.001. Statistically significant increases or decreases are indicated in red and blue, respectively. (A) Inverted walking animals display a significant decrease in tripod configurations while descending animals showed an increase. (B) Only ascending animals displayed a slight increase in tetrapod configurations. (C) Inverted walking animals display a significant increase in the use of wave conformations while ascending animals showed a slight decrease. (D) No variation was observed in the number of non-canonical combinations for all experimental groups. (E) Step patterns and tripod/transition phases. (E) and (E’) display two representative videos of animals walking upright and inverted at similar speeds, respectively. In the upper section, for each leg, swing phases are represented in black (from top to bottom: right hind (RH); right middle (RM); right front (RF); left hind (LH); left middle (LM); left front (LF)). Vertical dashed green lines represent the boundaries of a tripod stance phase. Lower section represents the periods associated with tripod and transition (or inter-Tripod time) phases depicted in green and grey, respectively. (F) Non-upright walking animals display a significant increase in inter-Tripod time. (G) Animals walking in a vertical plane display an increase in the average duration of each tripod stance phase. (H) Summary of kinematic affects under non-upright conditions. For simplicity, only the step cycle of the right foreleg is represented. Dashed green line represents the swing phase from PEP to AEP. Waved red line represents stance traces. Solid triangle represents the tripod conformation formed by RF, LM and RH. Dashed triangle represents the immediately subsequent tripod conformation. Purple dashed line represent the inter-Tripod time between the two tripod conformations. Brown and blue arrows represent the qualitative variations compared to upright walking animals observed for inverted and ascending/descending, respectively.

