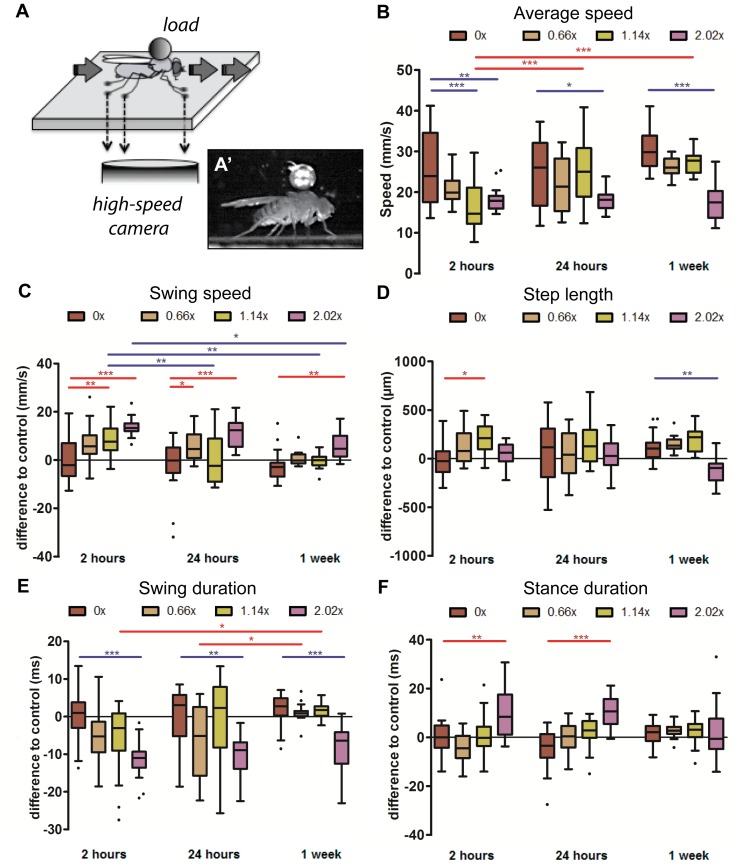
Figure 4. Imaging setup and step parameters.
(A) Recording setup. Flies were allowed to walk freely inside a walking chamber on an optical glass with a metal ball bearing attached to the notum. A high-speed camera recorded body and tarsal contacts on the optical glass. (A’) Representative image of a fly carrying a metal ball bearing. (B–F) Box plots represent the median as the middle line, with the lower and upper edges of the boxes representing the 25% and 75% quartiles, respectively; the whiskers represent the range of the full data set, excluding outliers. Circles indicate outliers. Statistical significance was determined using 2-way-ANOVA with post-hoc t-tests, where * p<0.05; ** p<0.01; *** p<0.001. Statistically significant increases or decreases are indicated in red and blue, respectively. (B) Average Speed. Flies bearing 0.66× and 1.14× show a recovery in average speed by one week, while flies bearing 2.02× do not. (C) Swing speed. The immediate effect of weight is an increase in swing speed, although it decreased to that of controls for flies bearing 0.66× and 1.14× by 1 week. (D) Step length. Step length shows weight-dependence only, where intermediate weights increases step length at 2 hours and the heaviest weight decreases step length at 1 week. (E) Swing duration. Swing duration is significantly decreased for flies bearing 2.02×. (F) Stance duration. Stance duration is increased only for the heaviest weight.

