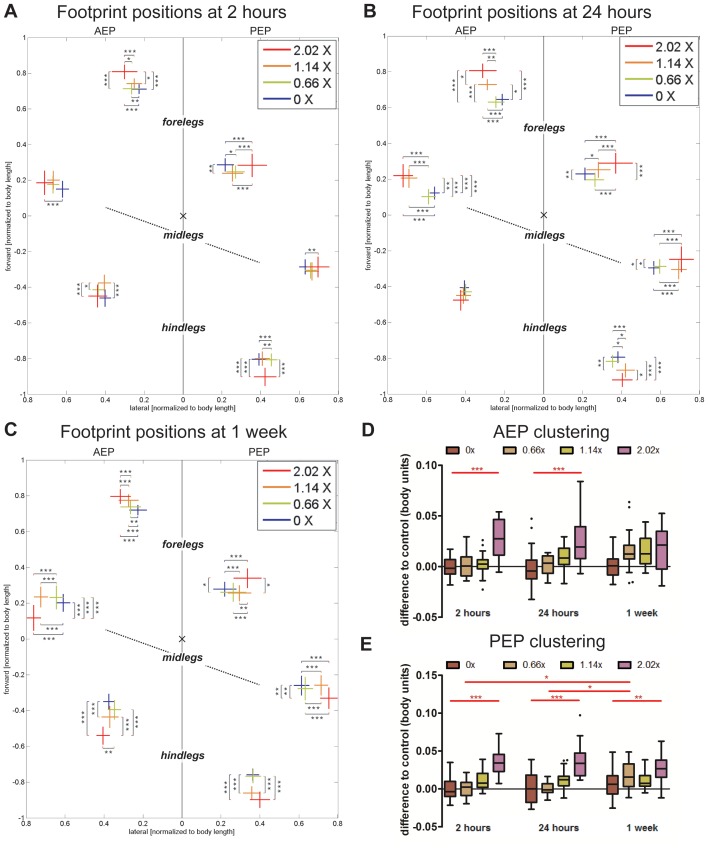
Figure 5. Spatial parameters.
(A–C) Footprint positions relative to the body center. AEP and PEP values for each leg are represented on the left and right sections of the plot, respectively. Values are normalized for body size. Line size denotes standard deviations, while intersection indicates mean value. Statistical significance was determined using 2-way-ANOVA with Tukey’s post-hoc tests and post-hoc t-tests, where * p<0.05; ** p<0.01; *** p<0.001. Statistically significant increases are indicated in red. (D–E) AEP and PEP Clustering. Box plots represent the median as the middle line, with the lower and upper edges of the boxes representing the 25% and 75% quartiles, respectively; the whiskers represent the range of the full data set, excluding outliers. Circles indicate outliers. Values show a significant footprint dispersal in 2.02× bearing flies compared to controls.

