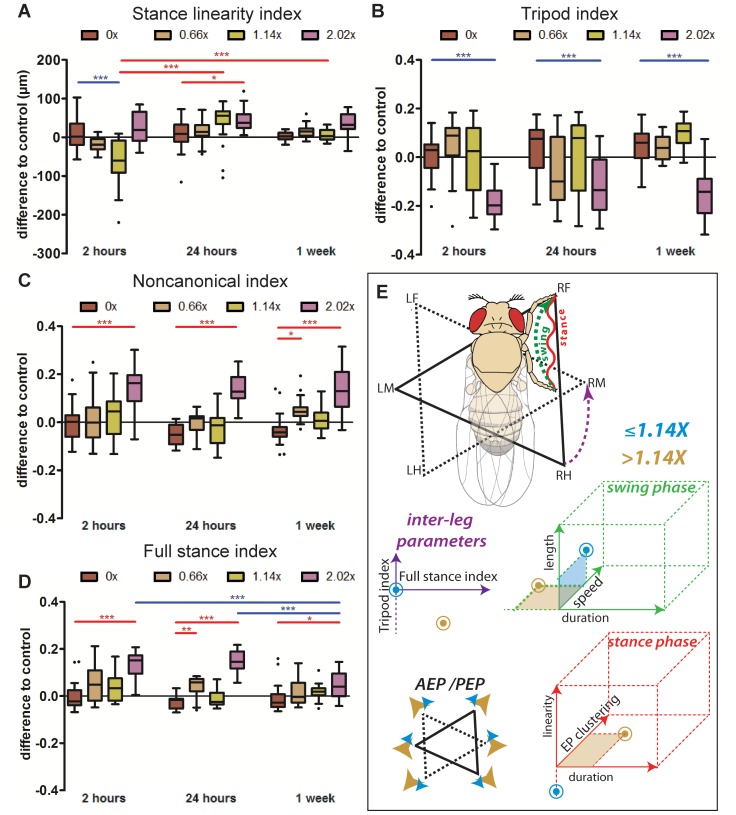
Figure 6. Stance linearity, interleg coordination parameters and summary of kinematic effects under different load conditions.
(A–D) Box plots represent the median as the middle line, with the lower and upper edges of the boxes representing the 25% and 75% quartiles, respectively; the whiskers represent the range of the full data set, excluding outliers. Circles indicate outliers. Statistical significance was determined using 2-way-ANOVA with post-hoc t-tests, where * p<0.05; ** p<0.01; *** p<0.001. Statistically significant increases or decreases are indicated in red and blue, respectively. (A) Stance Linearity Index. Flies bearing intermediate weights show less wobble during stance phases compared to controls at 2 hours, while flies bearing the heaviest loads display more wobble at all time points. (B) Tripod Index. Flies bearing 2.02× weights show significantly reduced tripod index at all three time points. (C) Non-canonical Index is markedly increased for flies bearing 2.02× weights. (D) Full Stance Index is increased for 2.02× bearing flies at all time points. (E) Summary of kinematic affects due to load bearing. For simplicity, only the step cycle of the right foreleg is represented. Dashed green line represents the swing phase from PEP to AEP. Waved red line represents stance traces. Solid triangle represents the tripod conformation formed by RF, LM and RH. Dashed triangle represents the immediately subsequent tripod conformation. Purple dashed line represents the transition between the two tripod conformations. Blue points represent the qualitative effects transiently observed for animals carrying 1.14× or lighter weights, while brown points represent the effects observed for walking animals carrying 2.02× weights.

